The LESO-PB building building control system 0.0015 Density - - PowerPoint PPT Presentation

the leso pb building
SMART_READER_LITE
LIVE PREVIEW

The LESO-PB building building control system 0.0015 Density - - PowerPoint PPT Presentation

Integrating R in an advanced The LESO-PB building building control system 0.0015 Density estimate 0.0010 0.0005 0.0000 0 500 1000 1500 2000 2500 3000 3500 [lux] David Lindelf David Lindelf useR! 2006 useR! 2006 15/06/2006


slide-1
SLIDE 1

David Lindelöf useR! 2006 15/06/2006 Vienna david.lindelof@epfl.ch

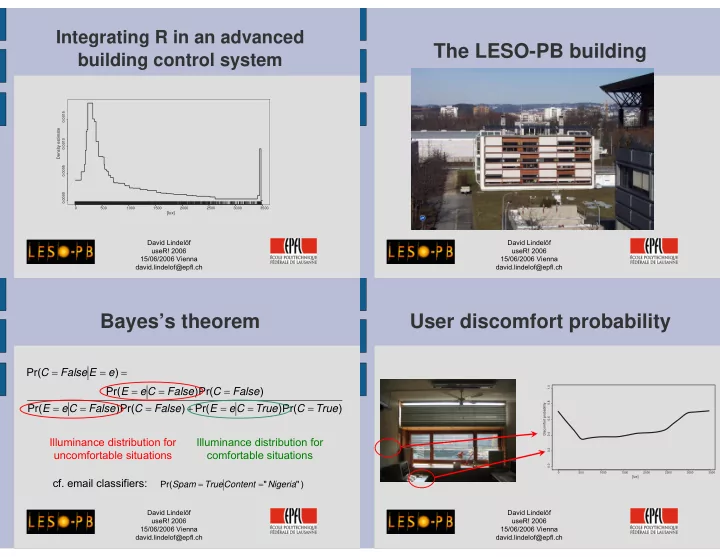
Integrating R in an advanced building control system

500 1000 1500 2000 2500 3000 3500 0.0000 0.0005 0.0010 0.0015

[lux] Density estimate

David Lindelöf useR! 2006 15/06/2006 Vienna david.lindelof@epfl.ch

The LESO-PB building

David Lindelöf useR! 2006 15/06/2006 Vienna david.lindelof@epfl.ch

Bayes’s theorem

) Pr( ) Pr( ) Pr( ) Pr( ) Pr( ) Pr( ) Pr( True C True C e E False C False C e E False C False C e E e E False C = = = + = = = = = = = = = Illuminance distribution for uncomfortable situations Illuminance distribution for comfortable situations

) " " Pr( Nigeria Content True Spam = =

  • cf. email classifiers:

David Lindelöf useR! 2006 15/06/2006 Vienna david.lindelof@epfl.ch

User discomfort probability

500 1000 1500 2000 2500 3000 3500 0.0 0.2 0.4 0.6 0.8 1.0 [lux] Discomfort probability

slide-2
SLIDE 2

David Lindelöf useR! 2006 15/06/2006 Vienna david.lindelof@epfl.ch

Density estimation methods

0.0 0.2 0.4 0.6 0.8 1.0 2 4 6 8 10 12

True density Histogram

0.0 0.2 0.4 0.6 0.8 1.0 2 4 6 8 10 12 0.0 0.2 0.4 0.6 0.8 1.0 2 4 6 8 10 12

Spline SHK97

0.0 0.2 0.4 0.6 0.8 1.0 2 4 6 8 10 12

Kernel SJ91

0.0 0.2 0.4 0.6 0.8 1.0 2 4 6 8 10 12

Taut string

0.0 0.2 0.4 0.6 0.8 1.0 2 4 6 8 10 12

Total variation

David Lindelöf useR! 2006 15/06/2006 Vienna david.lindelof@epfl.ch

Density estimation with Davies & Kovac’s ftnonpar package

) Pr( False C e E = =

500 1000 1500 2000 2500 3000 3500 0.000 0.001 0.002 0.003 0.004 [lux] Density estimate 500 1000 1500 2000 2500 3000 3500 0.0000 0.0005 0.0010 0.0015 [lux] Density estimate

) Pr( True C e E = =

David Lindelöf useR! 2006 15/06/2006 Vienna david.lindelof@epfl.ch

500 1000 1500 2000 2500 3000 3500 0.0 0.2 0.4 0.6 0.8 1.0

[lux] Discomfort probability

Discomfort probability

) Pr( e E False C = =

David Lindelöf useR! 2006 15/06/2006 Vienna david.lindelof@epfl.ch

Combination of variables

Horizontal workplane illuminance [lux] Eye−level illuminance [lux] 500 1000 1500 500 1000 1500

Horizontal and eye-level illuminances

slide-3
SLIDE 3

David Lindelöf useR! 2006 15/06/2006 Vienna david.lindelof@epfl.ch

Summary

  • R called from a Java program to perform density

estimation with taut-string algorithm

  • Data prepared with an R script, then Davies &

Kovac’s ftnonpar package computes the estimation