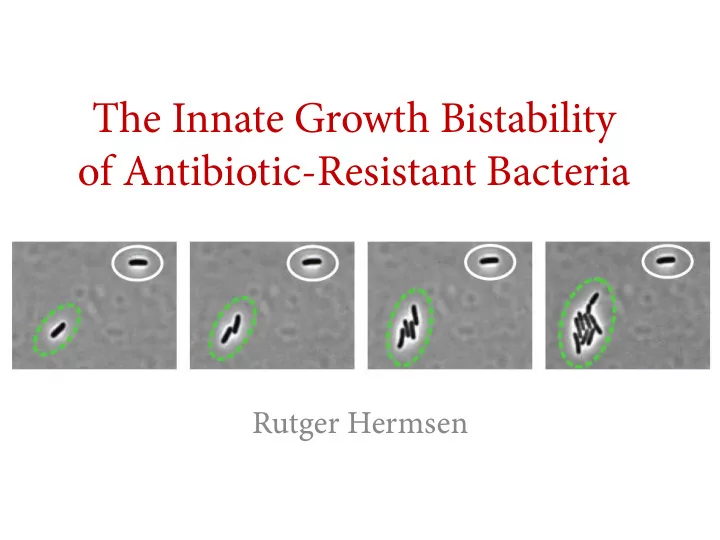
SLIDE 1 The Innate Growth Bistability
- f Antibiotic-Resistant Bacteria
Rutger Hermsen
SLIDE 3
Antibiotic-resistant bacteria: a major health concern
World Health Organization (2014): “This serious threat is no longer a prediction for the future, it is happening right now in every region of the world and has the potential to affect anyone, of any age, in any country. Antibiotic resistance (…) is now a major threat to public health”
SLIDE 4
SLIDE 5
SLIDE 6
Today, we will discuss the following paper
SLIDE 7
Growth bistability observed in resistant cells
Growth of E. coli bacteria carrying an unregulated resistance gene (CAT), in sub-lethal antibiotic concentration (0.9µM chloramphenicol). Cm added at time 𝑢 = 0.
SLIDE 8
Halted cells resume growth after Cm is removed
Medium with lower Cm concentration (0.1 µM) is flown in after 24 h. After some time, the cells resume growth.
SLIDE 9 Conclusions from movie clip
Spontaneous formation of two subpopulations:
- Some bacteria grow just fine.
- Other bacteria completely stop growing
- The non-growing cells are not dead: they resume
growth after chloramphenicol is removed.
SLIDE 10 Actually… predicted by a quantitative model
- We expect a funny kind of
positive feedback loop.
- Positive feedback can lead
to bistability.
- At the end of this lecture,
you should be able to understand this model, and why it explains growth bistability.
1 2 3 4
The poor stay poor, and the rich get rich that’s how it goes and everybody knows. – Leonard Cohen, “Everybody knows”
SLIDE 11
- 2. Ingredients of the model
SLIDE 12 Ingredient 1: diffusion of Cm into the cell
Cm enters the cell passively, by
𝐾influx = 𝜆( Cm ext − Cm int) Here, 𝜆 is the cell’s permeability for Cm.
1 2 3 4
SLIDE 13
Ingredient 2: Inactivation of Cm by the CAT protein.
1 2 3 4
SLIDE 14
Chloramphenicol (Cm) vs CAT
Cm: A prototypical broad-band antibiotic. Bacteriostatic drug; works by binding to the 50S ribosomal subunit, preventing protein chain elongation. CAT (Cm acetyltransferase): Covalently attaches acetyl group to chloramphenicol, preventing it from binding to ribosomes.
SLIDE 15 Ingredient 2: Inactivation of Cm by the CAT protein.
Assume standard Michaelis-Menten kinetics:
𝐾CAT = 𝑊
max
Cm int Cm int + 𝐿m
𝑊
max depends on the
concentration of the enzyme CAT.
SLIDE 16
?
Cm int as a function of Cm ext: Dutch analogy
As long as the capacity of the wind mill exceeds the leakage into the polder, the water level in the polder stays low. If the leakage exceeds the capacity of the wind mill, the polder floods.
SLIDE 17 The equilibrium value of Cm int
We already assumed:
𝐾influx = 𝜆( Cm ext − Cm int)
𝐾CAT = 𝑊
max
Cm int Cm int + 𝐿m
Dynamics of Cm int:
𝑒 Cm int 𝑒𝑢 = 𝐾influx − 𝐾CAT
The equilibrium concentration of
Cm int is such that: 𝐾influx = 𝐾CAT
𝐃𝐃 𝐣𝐣𝐣
𝐾CAT 𝐾CAT 𝜆 Cm ext
SLIDE 18
Result: threshold-linear response
Parameters: (Vmax/𝜆) and 𝐿m
SLIDE 19
Ingredient 3: Effect of Cm on growth rate
1 2 3 4
SLIDE 20 Ingredient 3: Effect of Cm on growth rate
Binding reaction: Cm + Rb ↔ Cm ⋅ Rb. Equilibrium:
Rb free Rb total = 1 1+ Cm int/𝐽50 .
Without Cm: 𝜇0 = 𝛿 Rb total. With Cm: 𝜇 = 𝛿 Rb free. So:
𝜇0 𝜇 = 1 + Cm int 𝐽50
. (Full disclosure: I’m cheating a little, because Rb total depends
- n 𝜇… Luckily, linearity remains
in a more careful derivation.)
SLIDE 21
Ingredient 4: Effect of growth rate on CAT expression
1 2 3 4
SLIDE 22 Effect of growth rate on expression of unregulated genes
𝐹 ∝ 𝜇.
𝑊
max = 𝑊
𝜇 𝜇0
no regulation.
SLIDE 23
Naive expectation contradicts finding
Typical model of gene expression would be: 𝑒𝑑 𝑒𝑢 = 𝛽 − 𝜇 𝑑 Expected equilibrium: 𝑑∗ = 𝛽 𝜇 . Therefore, naively one would expect 𝑑 to decrease with 𝜇. The opposite is found!
SLIDE 24
The answer:
SLIDE 25
?
Ribosome concentration increases with growth rate, if nutrient quality is varied
This can be understood: faster growth requires a larger rate of protein synthesis. Protein mass: 𝑒𝑁 𝑒𝑢 = 𝛿𝜚R𝑁, 𝑁 𝑢 ∝ e𝛿𝜚R𝑢 So, growth rate: 𝜇 = 𝛿𝜚R.
SLIDE 26
?
Ribosome concentration decreases with growth rate, if Cm is varied instead
Remember: Cm inhibits ribosomes. Interpretation: The cell perceives interference by Cm as a Rb shortage, and responds by synthesizing more of them. Plausible regulation:
SLIDE 27
Un-regulated genes respond differently to nutrient changes and antibiotic changes.
Interpretation: Given a fixed cell density, if the cell invests in a large concentration of ribosomes (up to 50% of protein mass!), this must lead to a reduced concentration of other proteins.
SLIDE 28 Proteome partitioning
Better nutrient
Growth rate increases Growth rate decreases
SLIDE 29 Putting everything together
𝐾influx = 𝜆 Cm ext − Cm int (1) 𝐾CAT = 𝑊
max Cm int Cm int+𝐿m
(2) 𝐾influx = 𝐾CAT
𝜇0 𝜇 = 1 + Cm int /𝐽50
(4) 𝑊
max = 𝑊 𝜇 𝜇0
(3) From these equations, 𝜇/𝜇0 can be calculated as a function of Cm ext. The behavior is affected by two dimensionless parameters:
𝜍 ≡
𝑊 𝜆 𝐿m , and 𝜏 ≡ 𝐽50/𝐿m.
SLIDE 30
- 3. Predictions and verification
SLIDE 31 Model prediction
If the resistance efficacy 𝜍 is above a critical value 𝜍C, the solution has two stable branches. Growth bistability! Remember that 𝜍 ≡
𝑊 𝜆 𝐿m.
Therefore, we can manipulate 𝜍 by simply changing the promoter driving CAT.
Cm ext
SLIDE 32 Experimental results
Fit of the model to these data fixes the remaining parameters.
SLIDE 33 Varying the value of 𝑊
All parameters were fixed by previous slide, except 𝑊
0,
which can be measured independently. Excellent fits result.
SLIDE 34
- 4. Discussion & conclusions
SLIDE 35 Discussion & Conclusions
- Strains with unregulated resistance genes can show bistable
growth when exposed to the drug. (We showed this for chloramphenicol, tetracycline, and minocycline.)
- No specific regulation required, no molecular cooperativity
required.
- Cannot be understood from “local” genetic circuits; the result of
global constraints and the organization of bacterial growth control.
- Calls into question basic notions of drug resistance, such as
MIC, which is based on bulk measurements instead of behavior at the single-cell level.
- Growth bistability can have effects on drug-drug interactions.
E.g., cells that do not grow are not killed by ampicillin. (Blocks cell wall synthesis.)
SLIDE 36
Thanks!
SLIDE 37
SLIDE 38
SLIDE 39
SLIDE 40