the enforcement system
play

The Enforcement System on March 4, 2012 Enforcement sites: 55 - PDF document

Outline The digital camera enforcement system Yellow Signal Driver Crossing Behavior Research framework and data Hillel Bar-Gera, Edna Schechtman, Tal Zeevi Yellow Signal Behavior Background Ben-Gurion University of the Negev,


  1. Outline � The digital camera enforcement system Yellow Signal Driver Crossing Behavior � Research framework and data Hillel Bar-Gera, Edna Schechtman, Tal Ze’evi � Yellow Signal Behavior Background Ben-Gurion University of the Negev, Israel Oren Musicant, � Results Ariel University, Israel � Conclusions and Future Research 2015 IEEE 18th International Conference on Intelligent Transportation Systems Automatic digital enforcement in Israel � Automatic enforcement has been used in Israel since the mid 1960’s � Operations of a new digital enforcement system started The Enforcement System on March 4, 2012 � Enforcement sites: 55 intersections and 21 mid-section locations (as of December 2013)
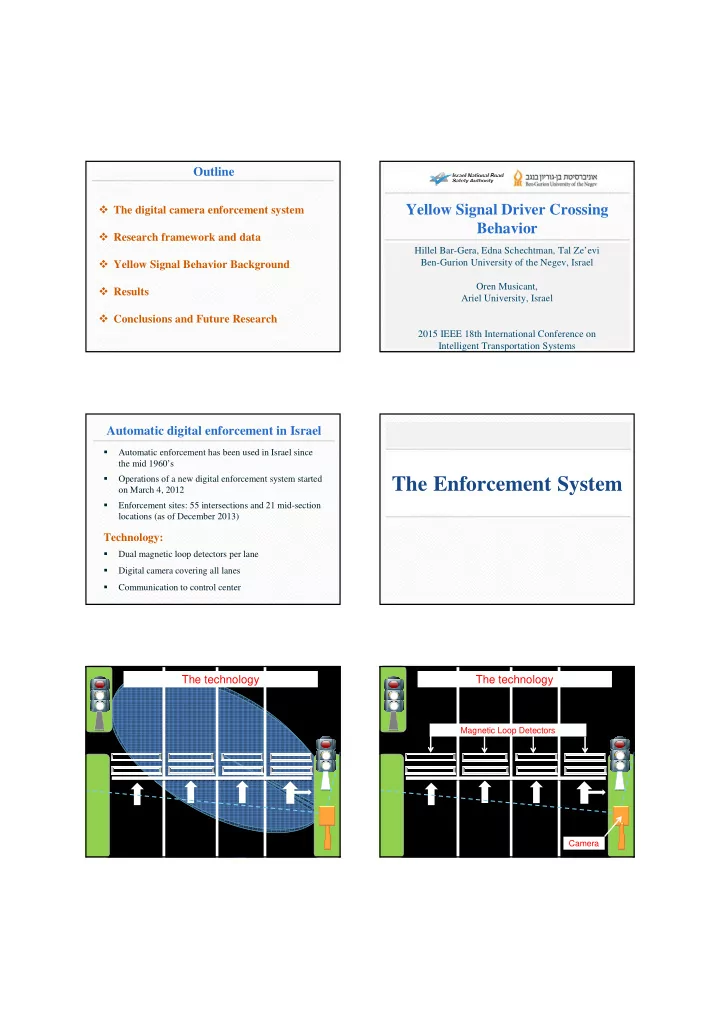
 Technology: � Dual magnetic loop detectors per lane � Digital camera covering all lanes � Communication to control center The technology The technology Magnetic Loop Detectors Camera

  2. Research Framework Overall Research Goal: to evaluate the effect of digital enforcement cameras on driver behavior and on safety. Research Framework Data Sources: � Point speed measurements (pneumatic) � Point-to-point speed measurements (BlueTooth) � Point-to-point speed measurements (GPS) � Enforcement system data: speeds, yellow crossings, citations. � Public opinion surveys on speed and enforcement � Accident data Scope of data Pneumatic speed measurements: • ~600,000 vehicles at 146 measurement lanes Yellow Signal Behavior: GPS data • ~100,000 vehicles, 42 road sections, 3 years Background ~ 700 million records (record: position, time and speed • of a single vehicle) Enforcement system data ~ 125 million observations at 21 speed cameras • ~ 285 million observations at 55 traffic signal cameras • Public opinions surveys at gas stations • 4 annual surveys at 9 gas stations, ~60 respondents per station. ~2,000 total respondents. Safety Implications of Definition of Yellow Onset States Traffic Signal Behavior (common perspective) Can stop safely Cannot stop � safely In 2012, 683 people were killed and an estimated 133,000 were injured in accidents that involved red Can cross before Multiple-options Should-cross light running in the US [IIHS, 2015]. red (#4) (#2) Cannot cross Should-stop No-safe-option � During 2004-2009 in West Australia 20% of serious before red (#1) (#3) casualty accidents at signalized intersections were rear- end, compared with only 4% at sign-controlled � Following Gazis, Herman Maradudin (1960). intersections [Devlin et al, 2011]. � “Can Cross” - assuming constant speed. � “Can Stop” - assuming “maximal” deceleration. � Variations in driver behavior are ignored.

  3. Crossing Probability Terminologies in Yellow Behavior Studies and the Extrapolated Entrance Time Proposed Extrapolated Yellow behavior Multiple- No-safe- taxonomy Entrance Time uncertainty options option (EET) situation situation Definitions: Liu et al. (1996) [8] Yellow interval � D ys – Distance at yellow onset dilemma � S ys – Speed at yellow onset Köll et al. (2004) Potential time Option zone Dilemma zone [6] � EET = D ys / S ys Extrapolated Entrance Time Gates et al. (2007) Estimated travel Dilemma zone / Dilemma zone Dilemma zone � AET – Actual Entrance Time [4] time Indecision zone Rakha et al. (2007) Time to Dilemma zone [9] intersection (TTI) EET is a key factor for predicting the probability that a Papaioannou, Option zone Dilemma zone (2007) [10] vehicle will cross the intersection at the end of the green Hurwitz et al. Time to stop bar Dilemma zone Dilemma zone Dilemma zone light (Haque et al., 2013; Gates et al., 2007). (2011) [11] type II type II type I Haque et al. (2013) Time to stop line [12] (TSL) Bar-Gera et al. Amber Onset Time Indecision zone (2013) [5] (AOT) Existing Data Collection Methodologies Study type: Results � Lab-type experiments: driving simulators, special purpose tracks. (e.g. Rakha et al., 2007; Haque et al., 2013; Bar-Gera et al. 2013; ) � Video measurements at real intersections. (e.g. Köll et al., 2004; Gates et al., 2007; Papaioannou, 2007) Limitations: � Sample sizes are limited. Typically, up to 2000 yellow crossing events. Entrance Time Distribution Yellow and Red Crossing Proportions After Yellow Onset

  4. Entrance Time Distribution: Entrance Time Distribution: Early Yellow Frequencies are Nearly Stable Nearly Stable Early Yellow Frequencies are Unstable Unstable (0< ∆ BIC<10, n=13) (10< ∆ BIC, n=6) Entrance Time Distribution: 4 Parameters Logistic - Early Yellow Frequencies are Stable Stable ( ∆ BIC<0, n=18) Yellow Phase Red Phase t Exponential Logistic vs. 4PL Comparison Logistic Regression - Yellow Phase Red Phase t

  5. Key Characteristics - Definitions Key Characteristics of All Intersections τ 0.9 τ 0.5 τ 0.1 τ 0.1-0.9 Entrance Time After the Yellow Onset [Ms] Key Characteristics Day-To-Night Comparison Conclusions and Future Research Future Research Summary and Conclusions • Examine causes of heterogeneity, within and • Loop detector data can be used to naturalistically between intersections. quantify driver behavior following yellow onset. • Evaluate influence on behavior of changes to • Results are based on ~5 million yellow crossings enforcement, signal timing, etc. (about 2.3% of all 200 million crossings). • Analyze connection to accident records. • Exponential logistic fits the data better than four- parameter logistic. • Add end-of-green frequencies. • The duration of frequency reduction from 90% to • Consider phase duration and cycle time as 10% ranges from 1.9s to 2.9s – substantial variation. explanatory variables. • Night-time and day-time behaviors are usually • Utilize other types of loop detectors (e.g. controller similar. detectors).

Download Presentation
Download Policy: The content available on the website is offered to you 'AS IS' for your personal information and use only. It cannot be commercialized, licensed, or distributed on other websites without prior consent from the author. To download a presentation, simply click this link. If you encounter any difficulties during the download process, it's possible that the publisher has removed the file from their server.

Recommend


More recommend