
SLIDE 1
The Economic Outlook TD Economics, April 2013
The Economic Outlook
Derek Burleton Vice President and Deputy Chief Economist
April 2013
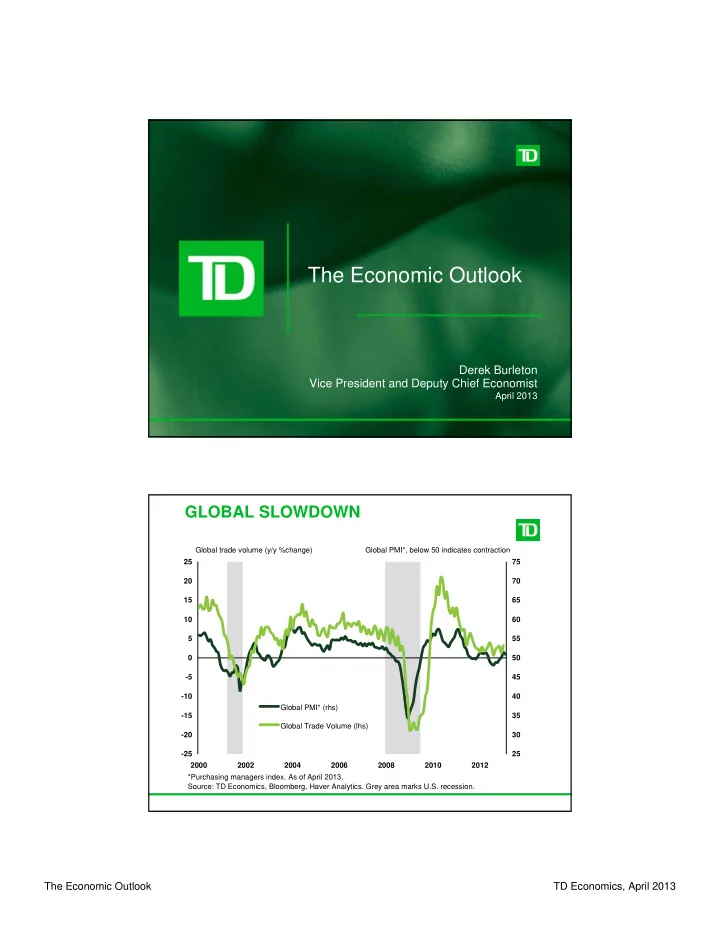
GLOBAL SLOWDOWN
- 25
- 20
- 15
- 10
- 5
5 10 15 20 25 2000 2002 2004 2006 2008 2010 2012 25 30 35 40 45 50 55 60 65 70 75 Global PMI* (rhs) Global Trade Volume (lhs) Global PMI*, below 50 indicates contraction Global trade volume (y/y %change) *Purchasing managers index. As of April 2013. Source: TD Economics, Bloomberg, Haver Analytics. Grey area marks U.S. recession.