
SLIDE 1
The Economic$ and Epidemiology of Intravitreal Injections
George A. Williams, M.D.
Beaumont Eye Institute
2016 Proctor Lecture
¥ I have the following financial interests or relationships to disclose:
¥ Alcon Laboratories, Inc.: Consultant/Advisor ¥ Allergan, Inc.: Consultant/Advisor, Grant Support ¥ ThromboGenics: Equity Owner ¥ ForSight: Consultant/Advisor, Equity Owner ¥ Johnson & Johnson: Consultant/Advisor ¥ OMIC-Ophthalmic Mutual Insurance Company: Employee ¥ OptiMedica: Consultant/Advisor, Equity Owner ¥ Retrosense: Consultant/Advisor, Equity Owner ¥ Vitamin Health: Consultant/Advisor ¥ Covalent Medical: Equity Owner
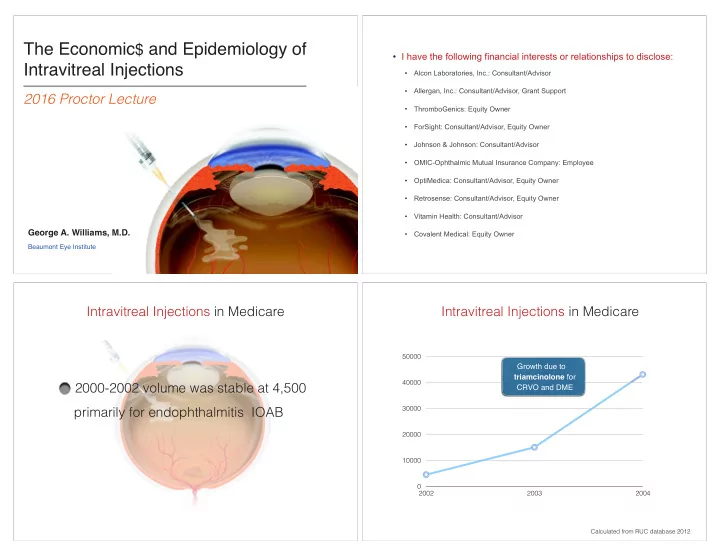
2000-2002 volume was stable at 4,500 primarily for endophthalmitis IOAB Intravitreal Injections in Medicare
10000 20000 30000 40000 50000 2002 2003 2004
Calculated from RUC database 2012
Intravitreal Injections in Medicare
Growth due to triamcinolone for CRVO and DME