SLIDE 1 1
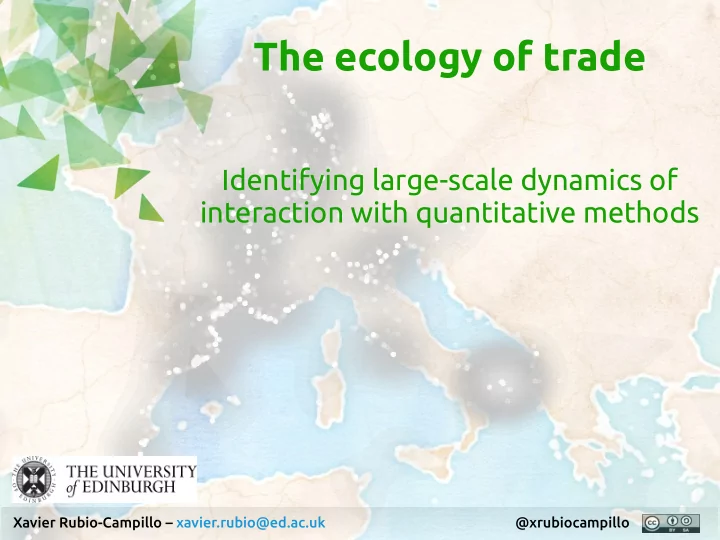
The ecology of trade
Identifying large-scale dynamics of interaction with quantitative methods
Xavier Rubio-Campillo – xavier.rubio@ed.ac.uk @xrubiocampillo
SLIDE 2
Summary
The wildlife of Roman quantifjcation The spatial structure of olive oil distribution Identifying province interaction Discussion
SLIDE 3 Why do we need quantitative methods?
«Statistical methods took hold in archaeology for good
Thomas, D. H. (1978). The awful truth about statistics in archaeology. American Antiquity, 231–244.
SLIDE 4 Why do we need quantitative methods?
«Statistical methods took hold in archaeology for good
«An unthinking, ritual approach to statistics lead to devastation of the underlying statistical models»
Thomas, D. H. (1978). The awful truth about statistics in archaeology. American Antiquity, 231–244.
SLIDE 5 How to choose a statistical method?
«Did you begin with a scientifjc problem in a defjnite domain and subject matter and only later considered the appropriateness of difgerent concept, models and methods in order to help solve it, or vice versa? That’s all. If you did the vice versa, you mouthtalked»
Thomas, D. H. (1978). The awful truth about statistics in archaeology. American Antiquity, 231–244.
SLIDE 6
Research question
Can we identify large-scale spatial patterns in the distribution of amphoric stamps?
SLIDE 7
Research question
Can we identify large-scale spatial patterns in the distribution of amphoric stamps?
Do closer sites exhibit more similar stamps?
SLIDE 8
Research question
Can we identify large-scale spatial patterns in the distribution of amphoric stamps?
Do closer sites exhibit more similar stamps? Can we identify other factors explaining similarity?
SLIDE 9
Quantitative methods in archaeology
Archaeological data is extremely complex
SLIDE 10
Quantitative methods in archaeology
Archaeological data is extremely complex
It is a proxy, not the real thing
SLIDE 11
Quantitative methods in archaeology
Archaeological data is extremely complex
It is a proxy, not the real thing It has plenty of noise It is always fragmented
SLIDE 12
Quantitative methods in archaeology
Archaeological data is extremely complex
It is a proxy, not the real thing It has plenty of noise It is always fragmented It has spatial uncertainty It has temporal uncertainty
SLIDE 13
Quantitative methods in archaeology
Archaeological data is extremely complex
It is a proxy, not the real thing It has plenty of noise It is always fragmented It has spatial uncertainty It has temporal uncertainty
We need new methods able to tackle these challenges... ...but where to fjnd them?
SLIDE 14 From data to interpretation
we quantify...
Amount Diversity Distribution
Bevan, A. (2014). Mediterranean Containerization. Current Anthropology, 55(4), 387–418.
SLIDE 15 From data to interpretation
we quantify...
Amount Diversity Distribution
...to understand:
Interactions Cooperation Competition
Bevan, A. (2014). Mediterranean Containerization. Current Anthropology, 55(4), 387–418.
SLIDE 16
The study of ecological dynamics
«Ecology is the study of interactions organisms have with each other, other organisms, and their environment. Topics of interest to ecologists include the diversity, distribution, amount, and number of particular organisms, as well as cooperation and competition between organisms, both within and among ecosystems» Wikipedia
SLIDE 17
From individuals...
SLIDE 18
From individuals...
SLIDE 19
...to populations
SLIDE 20
...to populations
SLIDE 21
From individuals...
SLIDE 22
From individuals...
SLIDE 23
From individuals...
SLIDE 24
...to populations
SLIDE 25
...to populations
SLIDE 26
...to populations
SLIDE 27
The wildlife of amphoric stamps
SLIDE 28
Identifying spatial structure
Idea: The stamps found in two neighbouring sites will be more similar than the stamps found in two distant sites
SLIDE 29 Identifying spatial structure
Idea: The stamps found in two neighbouring sites will be more similar than the stamps found in two distant sites also known as Isolation By Distance: «...pairs of populations close to each other will be more genetically similar to each other than populations farther away from each other»
Wright, S. (1943). Isolation by distance. Genetics, 28(2), 114.
SLIDE 30
Identifying spatial structure
Our null hypothesis
There is no correlation between geographical distance and stamp dissimilarity
SLIDE 31
Identifying spatial structure
Our null hypothesis
There is no correlation between geographical distance and stamp dissimilarity
Geographical distance
Cost matrix of pairwise distances between each site Euclidean distance
SLIDE 32
Identifying spatial structure
Our null hypothesis
There is no correlation between geographical distance and stamp dissimilarity
Geographical distance
Cost matrix of pairwise distances between each site Euclidean distance
Stamp dissimilarity
Matrix of Jaccard distances between sites Exactly the same stamps → Completely difgerent stamps 1 →
SLIDE 33 Jaccard distance
PNN QCM VIRG SRN Emporiae 1 1 1 Massalia 1 1 1 1 PNN QCM VIRG SRN Emporiae 1 1 1 Vindolanda 1 1
Jaccard distance: 0.25 Jaccard distance: 0.75
SLIDE 34
Mantel test of correlation
Computes the correlation between 2 distance matrices
SLIDE 35 Mantel test of correlation
Computes the correlation between 2 distance matrices Dressel 20 stamps:
Mantel statistic r: 0.0274 Signifjcance: 0.001
SLIDE 36 Mantel test of correlation
Computes the correlation between 2 distance matrices Dressel 20 stamps: But...do all sites provide the same information?
Mantel statistic r: 0.0274 Signifjcance: 0.001
SLIDE 37
Mantel test revisited
SLIDE 38 Mantel test revisited
Geographical distance explains around 10% of the stamps spatial distribution Sample size is critical!
SLIDE 39
All amphorae vs Dressel 20
SLIDE 40
Exploring other factors: provinces
We need a method to compare:
Our Jaccard distance matrix of pairwise similarity The province where the site was located
SLIDE 41
Exploring other factors: provinces
We need a method to compare:
Our Jaccard distance matrix of pairwise similarity The province where the site was located
What is the Probability that you 2 randomly picked sites have closer similarity than 2 sites of the same province? Null hypothesis:
There is no relation between the province of a site and its stamps
SLIDE 42 Multi-Response Permutation Procedure
MRPP allows us to assess if a specifjc grouping is linked to a dissimilarity matrix It evaluates statistical signifjcant difgerences between:
the mean distance within each group the mean distance for the entire dataset weighted by group sizes
Rodgers, P. (1987). Multi-Response permutation procedures. Computer and Quantitative Methods in Archaeology, 7957, 45–54. McCune, B., & Grace, J. (2002). MRPP (Multi-response Permutation Procedures) and related techniques. Analysis of Ecological Communities: MjM Software Design, Gleneden Beach, Oregon, USA, 188–197.
SLIDE 43 MRPP Dressel 20
Mean distances average within groups 0.994 between groups 0.996 efgect 0.002 signifjcance: 0.001
SLIDE 44 MRPP Dressel 20
Mean distances average within groups 0.994 between groups 0.996 efgect 0.002 signifjcance: 0.001
SLIDE 45
MRPP revisited
SLIDE 46 MRPP revisited
Province matters (a little...) Sample size is (again) critical!
SLIDE 47
All amphorae vs Dressel 20
SLIDE 48 All amphorae vs Dressel 20
Can we group provinces based on similarity?
SLIDE 49 Similarity between provinces
All stamps Sites with 25+ stamps
SLIDE 50
Similarity between provinces
SLIDE 51
Discussion
H1 – There is a correlation between geographical distance and stamp similarity H2 – There is a relation between the province of a site and its stamps
SLIDE 52
Discussion
H1 – There is a correlation between geographical distance and stamp similarity H2 – There is a relation between the province of a site and its stamps Additional hypotheses that can be tested:
Military sites have an independent logistic network Distribution is linked to riverine transport Atlantic and Mediterranean coasts are organised difgerently Difgerent amphoric types have difgerent distributions
SLIDE 53
Challenges
Probable correlation between province and spatial distance Euclidean distance is not the best idea Diversity is huge in any case Temporal dynamics are currently ignored
SLIDE 54
Concluding remarks
Choose the method after you choose your research question
SLIDE 55
Concluding remarks
Choose the method after you choose your research question The complexity of the archaeological record requires advanced quantitative methods
SLIDE 56
Concluding remarks
Choose the method after you choose your research question The complexity of the archaeological record requires advanced quantitative methods We need to move from Exploratory Analysis to Hypothesis Testing
SLIDE 57 @xrubiocampillo
Thank you!
xavier.rubio@ed.ac.uk «Humans are pattern-seeking story-telling animals, and we are quite adept at telling stories about patterns, whether they exist or not» Michael Shermer
Source code and dataset available at: https://github.com/xrubio/ecologyStamps