
SLIDE 1
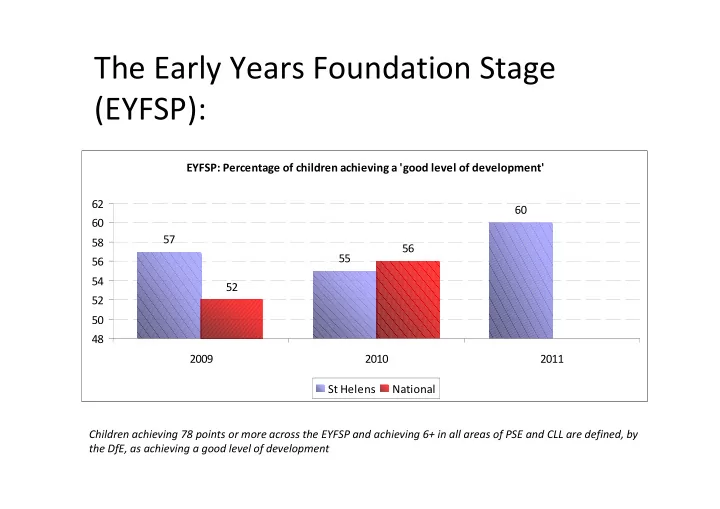
The Early Years Foundation Stage (EYFSP):
EYFSP: Percentage of children achieving a 'good level of development' 57 55 60 56 56 58 60 62 55 52 56 48 50 52 54 56 2009 2010 2011 St Helens National Children achieving 78 points or more across the EYFSP and achieving 6+ in all areas of PSE and CLL are defined, by the DfE, as achieving a good level of development