the cellular
play

The cellular nucleotides, metabolic fatty acids, etc. machine - PDF document

International Workshop on Complex Systems and International Workshop on Complex Systems and Networks 2007, Guilin Guilin, China , China Networks 2007, Metabolic Networks Metabolic Networks Organization, Biomass Production, and Other Issues


  1. International Workshop on Complex Systems and International Workshop on Complex Systems and Networks 2007, Guilin Guilin, China , China Networks 2007, Metabolic Networks Metabolic Networks Organization, Biomass Production, and Other Issues Organization, Biomass Production, and Other Issues
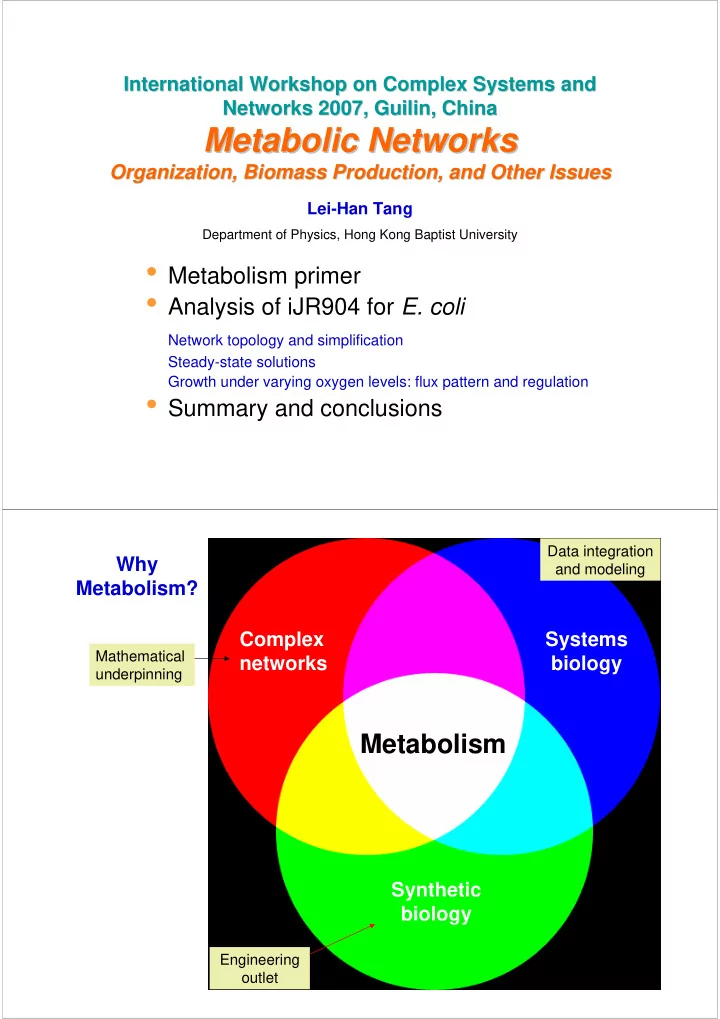
 Lei-Han Tang Department of Physics, Hong Kong Baptist University • Metabolism primer • Analysis of iJR904 for E. coli Network topology and simplification Steady-state solutions Growth under varying oxygen levels: flux pattern and regulation • Summary and conclusions Data integration Why and modeling Metabolism? Complex Systems Mathematical networks biology underpinning Metabolism Synthetic biology Engineering outlet

  2. glucose + NH4 amino acids, The cellular nucleotides, metabolic fatty acids, etc. machine Carbon Biomass/ source energy Other elements Redox waste agents Nicholson metabolic pathway chart Biosynthesis the flow chart

  3. Full metabolic eno E4.2.1.11: 2-Phospho-D-glycerate <=> Phosphoenolpyruvate + H2O network of pyk S. cerevisiae E2.7.1.40: ADP + Phosphoenolpyruvate <=> ATP + Pyruvate Complexity � 980 reactions involving 981 compounds catalyzed by 449 different enzymes � 1163 yeast ORFs with EC assignment (about 20% of yeast genome) Metabolic networks are scale free! H. Jeong, B. Tombo, R. Albert, Z. N. Oltvai, A.-L. Barabasi, Nature 407 , 651 (2000). k − ∼ 2.2 P k ( ) scale free k = connection degree Evolutionarily conserved across all three branches of living organisms

  4. Statistical physicist: another proof that scale free networks are ubiquitous! More refined characterization of network topology … Biological function Biologist/biochemist: every reaction matters! John Doyle: Organized complexity http://www.cds.caltech.edu/~doyle/ Basic elements: proteins Functional units: network motifs/ pathways Systems level organization: protocols Origin of complexity: Robustness! Temperature control Air bags EGR control Active Electronic fuel injection suspension Electronic ignition Electric power Electronic steering (PAS) transmission Cruise control Anti-lock brakes

  5. Basic biochemistry of metabolism Energy carbon flow Precursor molecules Synthetic efficiency controlled by energy and redox power Network Organization: Scale Rich! Reiko Tanaka and John Doyle, q-bio: 0410009

  6. E. Coli, iJR904 � Simplifying network topology � Analyze flux pattern under varying growth conditions � Study regulatory interactions in silico organisms constructed by Palsson’s group at UCSD � Collection of organism-specific reactions leading to biomass production � Allow for simulation of different growth conditions (nutrient uptake, O2 availability, etc.) � Outcome : growth rate and flux pattern

  7. Yeast H. pylori iND750 iIT341 750 ORFs with 1149 341 ORFs with 476 reactions and 646 reactions and 412 metabolites, fully metabolites compartmentalized E.coli iJR904 904 ORFs with 931 reactions and 625 metabolites NetSim : Specific objectives 1. Highlight carbon flow for easy comparison with relevant experimental flux measurements (clearly marked main roads, small streets, roundabouts, market place, etc.) 2. A quantitative understanding of the horizontal coupling between pathways (physico-chemical constraints such as energy/redox balance) 3. Incorporation of regulatory interactions with a clear understanding of their physiological role (traffic control and related issues) 4. A framework to integrate protein abundance, enzyme activity, and flux measurements for dynamic simulation

  8. Flux pattern: aerobic growth on glucose minimal medium 282 out of 1149 reactions with nonzero flux Thickness of arrows proportional to reaction flux phospholipids amino acids glucose TCA cycle nucleotides Flux pattern, glucose-minimal

  9. Core network from iJR904 pyrimidine arginine sugar proline urea cycle purine amino acids Metabolism in action: network traffic consider Steady State Flow (e.g. exponential growth phase) = v flux through th reaction i i = … v ( , v v , , v ) Network state specified by flux vector 1 2 N v pvk Example: E2.7.1.40: ADP + Phosphoenolpyruvate <=> ATP + Pyruvate dC ∑ ∑ = − = pyr m v m v 0 Law of mass action: i ,pyr i i ',pyr i ' dt producing rxn consuming rxn = i = Or more generally, S v 0 S stoichiometric matrix v Constrained by i) thermodynamics (70% irreversible) i Regulation and control ii) enzyme abundance and activity in a living cell, but the mechanisms are Current models: find flux solution through a extremely complex physiologically meaningful objective function (FBA)

  10. flux-balance analysis with realistic network topology carbon source (e.g. glucose) biomass provides carbon skeleton and energy Maximize using LP freely available compounds = i S v 0 Na + , K + , NH 4 + , SO 4 -2 , -2 , H 2 O, CO 2 HPO 4 aerobic/anaerobic waste (oxygen) Two recent studies in our group a) Independence in biosynthesis i) Dedicated flow: Optimize production of individual amino acids ii) Combined flow: Glucose Optimize production of the + NH4 basket of AA Q: can we achieve ii) from linear superposition of i)?

  11. Biomass Optimal Biomass constituent Optimal Result from in constituent yield yield silico study L-Alanine 17.143 dCMP 5.512 L-Arginine 6.6849 dGMP 4.4553 L-Asparagine 12.577 dTMP 4.8963 L-Aspartate 17.143 AMP 4.6833 The ratio of L-Cysteine 8.9135 CMP 5.6006 superposition yield to L-Glutamine 10 GMP 4.5952 optimal yield is L-Glutamate 10 UMP 5.9658 95.54%! Glycine 20 1,3-beta-D-Glucan 8.9744 L-Histidine 6.7653 glycogen 8.9744 L-Isoleucine 7.3118 Mannan 8.9744 L-Leucine 6.6667 Trehalose 4.6053 Synthesis of individual L-Lysine 6.5896 Ergosterol 0.91971 biomass components L-Methionine 6.1824 Phosphatidate 0.0093685 L-Phenylalanine 5.3353 Phosphatidylcholine 0.0079944 are only weakly L-Proline 9.5397 phosphatidylethanolamine 0.0089537 coupled! L-Serine 17.143 phosphatidylserine 0.0089428 L-Threonine 12.75 phosphatidyl-1D-myo- 0.0084474 inositol L-Tryptophan 4.0731 triglyceride 0.0064781 L-Tyrosine 5.5835 zymosterol 0.96685 L-Valine 9.2308 All above 1.4158 dAMP 4.5074 Superposition yield 1.3512 Coupling through complementary needs in energy/redox potential Decoupling of amino acid pairs by relaxation on energy requirement and redox balance Organism Original model Free ATP Free Free NADPH NADH S. cerevisiae 158 (190) 61 61 37 E. coli 160 (190) 65 5 5 H. pylori 31 (36) 16 0 0 Syntheses of two amino acids are coupled if one is abundant in certain redox/energy potential pair and the other is deficient of such pair. Free supply of the potential pair would thus eliminate coupling.

  12. Two recent studies in our group b) Aerobic/anaerobic growth and regulation E. coli has three metabolic modes to grow depending on the availability of electron acceptors: Aerobic respiration uses TCA cycle for pyruvate oxidation, while ATP is produced via the electron transport chain with O2 being the terminal electron acceptor Anaerobic respiration uses alternative terminal electron acceptors, such as NO3- in the electron transport chain Fermentation occurs when ATP is produced through substrate level phosphorylation. Q: Does FBA yield the same description? And how is the regulation of traffic achieved in bacteria? Biomass yield under varying oxygen levels ( in silico simulation, glucose minimal medium) Branch point key to regulation

  13. Transcriptional regulatory interaction in aerobic/anaerobic switch Main Regulators: The aerobic/anaerobic response regulation system includes the one component furmarate & nitrate reduction (Fnr) protein and the two-component anoxic redox control (Arc) system. The aerobic/anaerobic response regulation pathways in E. coli . Adapted from (Sawers G, The aerobic/anaerobic interface, 1999) Enzymes regulated by FNR and ArcA/B FNR arcA/B PFL ACKr PDH PTAr • Consistent with flow pattern obtained from FBA • Detailed dynamic modeling to be carried out

  14. Further downstream: The TCA Cycle Aerobiosis Anaerobiosis [4.1.3.6] [2.3.3.1] [1.1.1.37] [1.1.99.16] [4.2.1.3] FNR [4.2.1.2] ArcA/B [1.1.1.42] [1.3.99.1] [1.2.4.2] [6.2.1.5] [2.3.1.61] [1.8.1.4]

  15. Metabolism summary: Complexity in exchange for economy and robustness NH4+ � Provides support for cell’s need for building material and energy � Bacteria: efficient usage of nutrients crucial for species Over a 1000 propagation metabolic � Many entry and exit points intermediates � Many alternative pathways � Flow modulated by enzyme abundance and activity � Supported by a complex regulatory system at various levels Global properties of the metabolic network • Metabolic network topology can be greatly simplified when viewed in terms of vertical links (pathways) and horizontal couplings (currencies, carriers, etc.) • Synthesis of biomass components is highly independent. The horizontal independence is due to the efficiency of individual synthesis, while waste is mostly associated with energy/redox requirements to drive a synthetic pathway. Hence cell is able to produce varying amount of amino acids in response to different external or internal needs, with little influence to the production of other amino acids. • Branch points of flow are key to metabolic regulation.

Download Presentation
Download Policy: The content available on the website is offered to you 'AS IS' for your personal information and use only. It cannot be commercialized, licensed, or distributed on other websites without prior consent from the author. To download a presentation, simply click this link. If you encounter any difficulties during the download process, it's possible that the publisher has removed the file from their server.

Recommend


More recommend