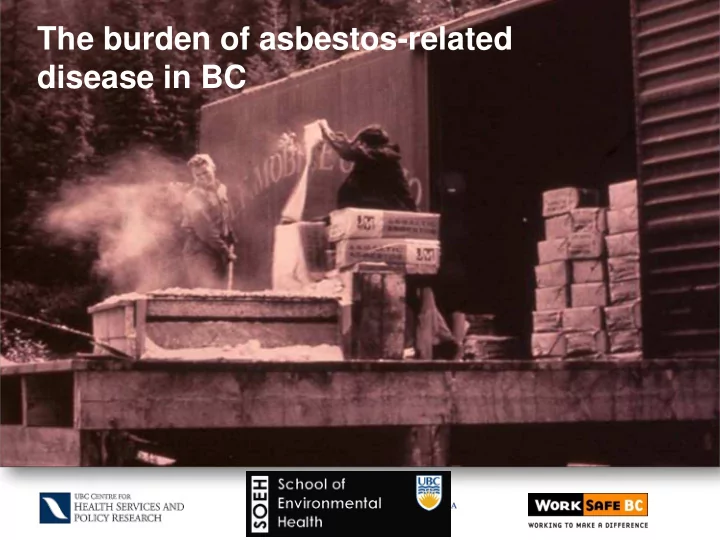

The burden of asbestos-related disease in BC
Asbestos Measurements (2,175) by Sector: BC, 1981-2004 Manufacturing 660 (30%) Service Sector 806 (37%) Auto Repair 239 (11%) Education 206 (9%) Healthcare 86 (4%) Construction 285 (13%) Government 233 (11%) Transportation 89 (4%)
Mean Concentration of Asbestos Fibres by Province and Year 2 [Asbestos fibres] (mean, f/cc) British 1.5 Columbia Ontario 1 0.5 0 80-84 85-89 90-94 95-02
Number of people exposed to asbestos by industry for British Columbia: 2006 Industrial group Number of workers Specialty trade contractors 13,000 Building construction 8,900 Ship and boat building 1,800 Automotive repair and maintenance 500 Pulp, paper & paperboard mills 400 Remediation & other waste management 300 Deep sea, coastal, great lakes water transport 200 Architectural, engineering & related services 200 Management, scientific & consulting services 100 All others 600 Total 26,000
Recognition of Asbestos-related Disease Health Effect Suspected Probable Established Asbestosis ~1900 ~1915 ~1930 Lung Cancer ~1930 ~1945 ~1955 Mesothelioma ~1940 ~1955 ~1965 Other Cancers ~1955 ~1970 ? From: U.S. IOM Asbestos, Selected Cancers, 2006. Original sources: Becklake (1976), Liddell (1997), Ross & Nolan (2003)
Mesothelioma Cases, 1970-2007
Asbestos Use in Canada and New Cases of Mesothelioma in Ontario and British Columbia 180 20000 18000 160 16000 140 Domestic Consumption 14000 120 Metric Tonnes 12000 BC Mesothelioma 100 10000 ON Mesothelioma 80 8000 60 6000 40 4000 20 2000 0 0 YEAR
n=312 111 New cases, 1992-2007 10
Asbestosis Incidence Men, 1992-2006 Asbestosis incidence increased from 5.3 to 6.5 per 100,000. *rate per 100,000 11
Asbestosis Incidence Women, 1992-2006 *rate per 100,000 12
Asbestosis Incidence Males, Census Division, 1995-2006
Cohort Studies Results: Ratios by Industry Railway Shipbuilding Mining Insulators Textile Cement Mix -10.00 -5.00 0.00 5.00 10.00 15.00 20.00 25.00 30.00 35.00 40.00 Ratio Excess Lung : Mesothelioma, geometric mean = 2.16 & arithmetic mean = 4.16
Case Control Results: Attributable Proportion of Lung Cancers due to Asbestos Exposure Funnel Plot: Number of Cases 2500 Number of Cases in the Case Control Study 2000 1500 1000 500 0 -15.00% -10.00% -5.00% 0.00% 5.00% 10.00% 15.00% 20.00% 25.00% Calculated PAR, lines at geometric mean = 6.7% and arithmetic mean = 7.3%
Excess Risk of Lung Cancer in BC • Attributable risk of lung cancer from case-control studies – Based on ~2900 new cases of lung cancer annually (mean of 2005-2007): 7.3 = 211, 8.7% = 250 asbestos-related lung cancers • Ratio of lung cancer cases to mesotheliomas in cohort studies – Based on 79 mesotheliomas per year (mean of 2005-2007): 2.16 = 170, 4.16 = 328 asbestos-related lung cancers
Other Asbestos-related Cancers Cancer Site IOM, 2006 (1) IARC, 2009 (2) Larynx Sufficient Sufficient Pharynx Suggestive Limited Stomach Suggestive Limited Colorectal Suggestive Limited Esophagus Inadequate Inadequate Ovary Not reviewed Sufficient (1) U.S. Institute of Medicine. Asbestos: Selected Cancers, 2006. (2) International Agency for Research on Cancer, Monograph 100 Working Group, 2009.
US IOM 2006 Review of Other Asbestos-related Cancers Cancer Site Conclusion Cohort Cohort Case-Control Overall High expo. Overall Larynx Sufficient 1.4 (1.2-1.6) 2.6 (1.5-4.5) 1.4 (1.1-1.8) Pharynx Suggestive 1.4 (1.0-2.0) 0.9 (0.2-4.2) 1.5 (1.0-2.0) Stomach Suggestive 1.2 (1.1-1.3) 1.3 (1.0-1.8) 1.1 (0.8-1.6) Colorectal Suggestive 1.2 (1.0-1.3) 1.4 (1.1-1.7) 1.2 (0.9-1.7) Esophagus Inadequate 1.0 (0.8-1.3) 1.4 (0.8-2.6) 1.5 (0.9-2.5) U.S. National Academy of Sciences. Asbestos: Selected Cancer, 2006.
Stomach & Lung Cancer Correlation in Asbestos Cohorts 5 4 Stomach Cancer SMR y = 0.4011x + 0.4125 R² = 0.6623 3 2 1 0 0 1 2 3 4 5 6 7 8 Lung Cancer SMR
Colorectal & Lung Cancer Correlation in Asbestos Cohorts 3 y = 0.2785x + 0.5419 R² = 0.5895 Colorectal Cancer SMRs 2 1 0 0 1 2 3 4 5 6 7 8 Lung Cancer SMRs
Asbestos-Related Diseases in BC Decades after major reductions in exposure, the burden is very high. Each year in BC there are: –60-80 new cases of mesothelioma –70-100 new cases of asbestosis –170-330 new cases of lung cancer –Smaller numbers of other cancers
UBC Asbestos Research Team Paul Demers 1,3 , Mieke Koehoorn 1,2,3 , Chris McLeod 1,2 , Anne-Marie Nicol 1,3 Wenqi Gan 1 , Tracy Kirkham 1 , Kim McLeod 1,2 , Cheryl Peters 1 , Kristin Hodgins 1 , Caitlin Blewett 1,3 Christie Hurrel 1,2 , Lillian Tamburic 2 , Fan Xu 2 , Jon Fan 2 1. UBC School of Environmental Health 2. Centre for Health Services & Policy Research 3. School of Population & Public Health Funded by: WorkSafe BC, Canadian Partnership Against Cancer, & Canadian Institutes for Health Research
Ad in Scientific American 1916
Recommend
More recommend