The Amazon effect Amazon vs Walmart Market Cap 2008-2018 $1,000 - - PowerPoint PPT Presentation

the amazon effect
SMART_READER_LITE
LIVE PREVIEW

The Amazon effect Amazon vs Walmart Market Cap 2008-2018 $1,000 - - PowerPoint PPT Presentation

The Amazon effect Amazon vs Walmart Market Cap 2008-2018 $1,000 $900 $800 $700 $600 USD Billion $500 $400 $300 $200 $100 $0 2008 2009 2010 2011 2012 2013 2014 2015 2016 2017 2018 Walmart Amazon Amazons market cap has


slide-1
SLIDE 1

The Amazon effect

Source: Bloomberg, July 2018.

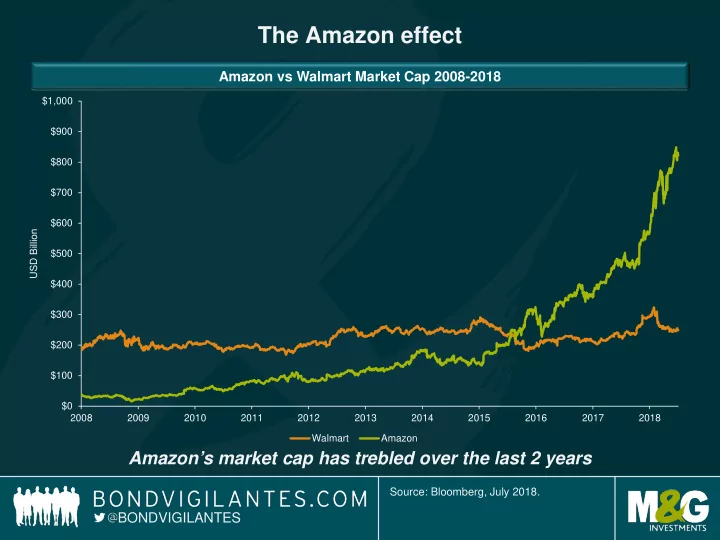
BONDVIGILANTES Amazon vs Walmart Market Cap 2008-2018

Amazon’s market cap has trebled over the last 2 years

$0 $100 $200 $300 $400 $500 $600 $700 $800 $900 $1,000 2008 2009 2010 2011 2012 2013 2014 2015 2016 2017 2018 USD Billion Walmart Amazon

slide-2
SLIDE 2

A Farewell to Shops?

Source: Office for National Statistics, May 2018.

BONDVIGILANTES Internet Sales as a % of Total Retail Sales (UK)

0% 5% 10% 15% 20% 25% 2006 2007 2008 2009 2010 2011 2012 2013 2014 2015 2016 2017

slide-3
SLIDE 3

0% 5% 10% 15% 20% 25% Consumer Electronics Consumer Appliances Apparel and Footwear Consumer Health Personal Accessories Beauty and Personal Cosmetics Home and Garden Pet Care Tissue and Hygiene Alcoholic Drinks Packaged Food

2007 2016

Online Winners & Bricks & Mortar survivors

Source: Euromonitor International, 2016.

BONDVIGILANTES 2007 vs 2016 % Share of Internet Retail in Total Retail

slide-4
SLIDE 4

From going online – to living online?

Source: eMarketer, March 2018. *Predicted data.

BONDVIGILANTES Expected global retail e-commerce sales 2014-2021

1,000 2,000 3,000 4,000 5,000 6,000 2014 2015 2016 2017 2018* 2019* 2020* 2021* USD Billion