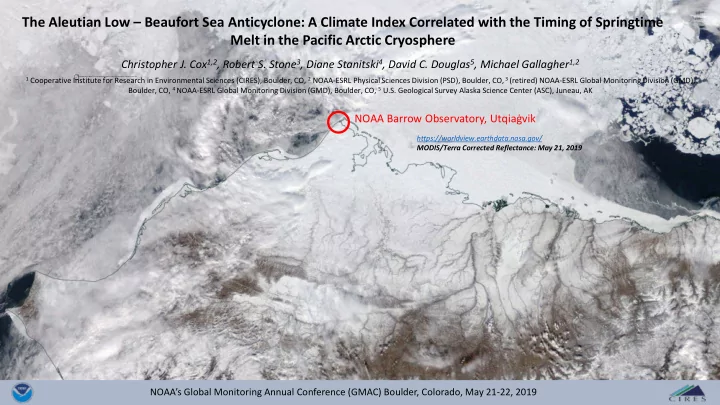

NOAA Barrow Observatory, Utqiaġvik
The Aleutian Low – Beaufort Sea Anticyclone: A Climate Index Correlated with the Timing of Springtime Melt in the Pacific Arctic Cryosphere
Christopher J. Cox1,2, Robert S. Stone3, Diane Stanitski4, David C. Douglas5, Michael Gallagher1,2
NOAA’s Global Monitoring Annual Conference (GMAC) Boulder, Colorado, May 21-22, 2019
1 Cooperative Institute for Research in Environmental Sciences (CIRES), Boulder, CO, 2 NOAA-ESRL Physical Sciences Division (PSD), Boulder, CO, 3 (retired) NOAA-ESRL Global Monitoring Division (GMD),
Boulder, CO, 4 NOAA-ESRL Global Monitoring Division (GMD), Boulder, CO, 5 U.S. Geological Survey Alaska Science Center (ASC), Juneau, AK https://worldview.earthdata.nasa.gov/ MODIS/Terra Corrected Reflectance: May 21, 2019
The linked image cannot be displayed. The file may have been moved, renamed, or deleted. Verify that the link points to the correct file and location. The linked image cannot be displayed. The file may have been moved, renamed, or deleted. Verify that the link points to the correct file and location.