SLIDE 1
Test your intuition!
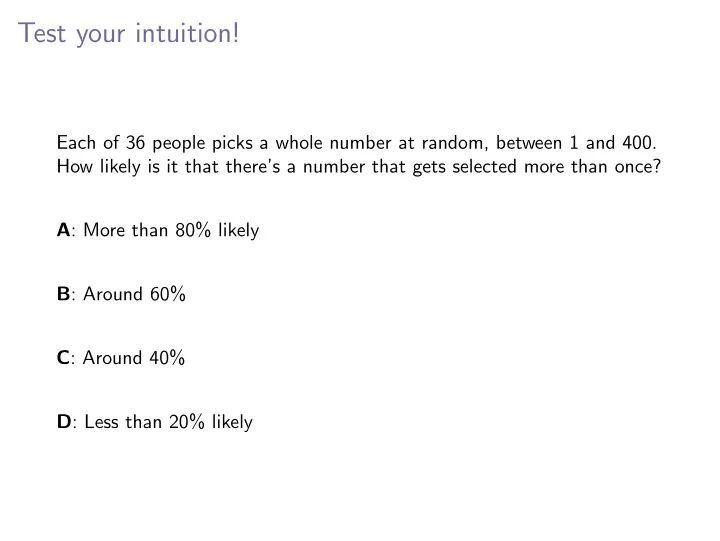
Each of 36 people picks a whole number at random, between 1 and 400. How likely is it that there’s a number that gets selected more than once? A: More than 80% likely B: Around 60% C: Around 40% D: Less than 20% likely
SLIDE 2
Multiplication and addition principles
Multiplication principle: If an experiment has two stages, with
◮ a1 outcomes for the first stage, and ◮ a2 outcomes for the second (regardless of what happened at the
first stage) then the total number of outcomes for the experiment is a1 × a2.
SLIDE 3
Multiplication and addition principles
Multiplication principle: If an experiment has two stages, with
◮ a1 outcomes for the first stage, and ◮ a2 outcomes for the second (regardless of what happened at the
first stage) then the total number of outcomes for the experiment is a1 × a2. Addition principle: If an experiment can proceed in one of two mutually exclusive ways, with
◮ a1 outcomes for the first way, and ◮ a2 outcomes for the second
then the total number of outcomes for the experiment is a1 + a2.
SLIDE 4
Sampling, with and without replacement
A bag has n distinguishable balls. Sampling: k balls are pulled from the bag, one after the other
SLIDE 5
Sampling, with and without replacement
A bag has n distinguishable balls. Sampling: k balls are pulled from the bag, one after the other Sampling without replacement: When a ball is pulled out, it is not returned to the bag. The number of samples of size k that can be drawn is Ak,n = (n)k = n · (n − 1) · · · · · (n − (k − 1)) = n! (n − k)! where n! = n · (n − 1) · · · · · 2 · 1.
SLIDE 6
Sampling, with and without replacement
A bag has n distinguishable balls. Sampling: k balls are pulled from the bag, one after the other Sampling without replacement: When a ball is pulled out, it is not returned to the bag. The number of samples of size k that can be drawn is Ak,n = (n)k = n · (n − 1) · · · · · (n − (k − 1)) = n! (n − k)! where n! = n · (n − 1) · · · · · 2 · 1. Sampling with replacement: When a ball is pulled out, it is returned to the bag. The number of samples of size k that can be drawn is nk.
SLIDE 7
Sampling without replacement or regard for order
Ordering: A bag has n distinguishable balls. The number of ways to take out the balls one by one and place them in order is n! = n × (n − 1) × · · · × 3 × 2 × 1 This is also the number of permutations of n objects.
SLIDE 8
Sampling without replacement or regard for order
Ordering: A bag has n distinguishable balls. The number of ways to take out the balls one by one and place them in order is n! = n × (n − 1) × · · · × 3 × 2 × 1 This is also the number of permutations of n objects. Sampling without replacement: The number of ways of drawing k balls from the bag, without replacement, in order, is (n)k = n · (n − 1) · · · · · (n − (k − 1)) = n! (n − k)!
SLIDE 9 Sampling without replacement or regard for order
Ordering: A bag has n distinguishable balls. The number of ways to take out the balls one by one and place them in order is n! = n × (n − 1) × · · · × 3 × 2 × 1 This is also the number of permutations of n objects. Sampling without replacement: The number of ways of drawing k balls from the bag, without replacement, in order, is (n)k = n · (n − 1) · · · · · (n − (k − 1)) = n! (n − k)! Sampling without replacement and without regard for order: The number of ways of drawing k balls from the bag, without replacement, with order not mattering, is (n)k k! = n! (n − k)!k! = n k
This can also be thought of as the number of ways of drawing k balls from the bag in a single draw.
SLIDE 10
Test your intuition!
On a cold winter’s night, 80 000 people trudge into Notre Dame stadium for a Garth Brooks concert. They each leave their scarves at the Knute Rockne gate. As they leave the concert, they each pick up a random scarf from the pile at the gate (they are all too cold to bother looking for their own scarf). How likely is it that no one comes away with the same scarf they arrived with? A: Very likely (more than 99%) B: More likely than not — around 2/3 C: Less likely than not — around 1/3 D: Very unlikely (less than 1%)
SLIDE 11 Dividing a group into smaller groups
Order mattering: The number of ways to split a set of n things into a first subset of size a1, a second of size a2, et cetera, up to a kth of size ak (so a1 + · · · + ak = n) is a multinomial coefficient: n a1 n − a1 a2
n − a1 − · · · − ak−1 ak
n! a1!a2! · · · ak! =
a1, a2, . . . , ak
SLIDE 12 Dividing a group into smaller groups
Order mattering: The number of ways to split a set of n things into a first subset of size a1, a second of size a2, et cetera, up to a kth of size ak (so a1 + · · · + ak = n) is a multinomial coefficient: n a1 n − a1 a2
n − a1 − · · · − ak−1 ak
n! a1!a2! · · · ak! =
a1, a2, . . . , ak
- Order not mattering: The number of ways to split the set into k equal
sized subsets (size n/k each), order not mattering, is 1 k!
n/k, n/k, . . . , n/k
n! ((n/k)!)kk!
SLIDE 13 Dividing a group into smaller groups
Order mattering: The number of ways to split a set of n things into a first subset of size a1, a second of size a2, et cetera, up to a kth of size ak (so a1 + · · · + ak = n) is a multinomial coefficient: n a1 n − a1 a2
n − a1 − · · · − ak−1 ak
n! a1!a2! · · · ak! =
a1, a2, . . . , ak
- Order not mattering: The number of ways to split the set into k equal
sized subsets (size n/k each), order not mattering, is 1 k!
n/k, n/k, . . . , n/k
n! ((n/k)!)kk! The number of ways to split the set into m1 subset each of size a1, m2 of size a2, et cetera, up to mk of size ak (so m1a1 + · · · + mkak = n) is:
a1,...a1,a2,...,a2,...,ak,...,ak
= n! (a1!)m1(a2!)m2 · · · (ak!)mkm1!m2! · · · mk!
SLIDE 14
Inclusion-Exclusion
A1, A2, . . . , An events in a sample space S (think of Ai as event “(at least) ith thing occurs (and maybe other things, too)”) A1cupA2 ∪ . . . ∪ An is the event “at least one of the i things occurs” Inclusion-Exclusion: P(A1 ∪ A2 ∪ . . . ∪ An) can be calculated as P(A1) + P(A2) + · · · + P(An) −P(A1 ∩ A2) − P(A1 ∩ A3) − · · · − P(An−1 ∩ An) +P(A1 ∩ A2 ∩ A3) + · · · + P(An−2 ∩ An−1 ∩ An) − · · · +(−1)n−1P(A1 ∩ A2 ∩ · · · ∩ An)
SLIDE 15
Inclusion-Exclusion
A1, A2, . . . , An events in a sample space S (think of Ai as event “(at least) ith thing occurs (and maybe other things, too)”) A1cupA2 ∪ . . . ∪ An is the event “at least one of the i things occurs” Inclusion-Exclusion: P(A1 ∪ A2 ∪ . . . ∪ An) can be calculated as P(A1) + P(A2) + · · · + P(An) −P(A1 ∩ A2) − P(A1 ∩ A3) − · · · − P(An−1 ∩ An) +P(A1 ∩ A2 ∩ A3) + · · · + P(An−2 ∩ An−1 ∩ An) − · · · +(−1)n−1P(A1 ∩ A2 ∩ · · · ∩ An) P((A1 ∪ A2 ∪ . . . ∪ An)c), event “none of the i things occur”, can be calculated as 1 − (P(A1) + · · · + P(An)) +(P(A1 ∩ A2) − · · · − P(An−1 ∩ An)) + · · · +(−1)nP(A1 ∩ · · · ∩ An)
SLIDE 16 Putting indistinguishable balls in distinguishable boxes
The number of ways to distribute k indistinguishable balls among n distinguishable boxes, which is the same as number of solutions to a1 + a2 + · · · + an = k with all ai ≥ 0, is n + k − 1 n − 1
n + k − 1 k
SLIDE 17 Putting indistinguishable balls in distinguishable boxes
The number of ways to distribute k indistinguishable balls among n distinguishable boxes, which is the same as number of solutions to a1 + a2 + · · · + an = k with all ai ≥ 0, is n + k − 1 n − 1
n + k − 1 k
The number of ways, if each box should get at least one ball, which is the same as the number of solutions to a1 + a2 + · · · + an = k with all ai ≥ 1, which is the same as the number of solutions to a′
1 + a′ 2 + · · · + a′ n = k − n
with all a′
i ≥ 0, is
(k − n) + (n − 1) n − 1
k − 1 n − 1
SLIDE 18 Test your intuition!
The World anti-doping agency (WADA) conducts random drug tests on
- lympic athletes. One test is for the presence of meldonium, a drug
which is estimated to be used by 1 out of every 200 olympic athletes. The test is 98% accurate: 98% of the time that meldonium is present in a sample, the test will correctly detect it, and 98% of the time that meldonium is absent from a sample, the test will correctly report the absence. An athlete is selected at random, and tests positive for meldonium. How likely is it that the athlete is actually using meldonium? A: Around 98% B: Close to 75% C: Close to 50% D: Close to 25% E: Around 2%
SLIDE 19
Drug testing example
Meldonium is estimated to be used by 1 out of every 200 athletes. A certain meldonium test is 98% accurate: 98% of the time that meldonium is present in a sample, the test will correctly detect it, and 98% of the time that meldonium is absent from a sample, the test will correctly report the absence. An athlete is selected at random, and tests positive for meldonium. How likely is it that the athlete is actually using meldonium?
SLIDE 20
Drug testing example
Meldonium is estimated to be used by 1 out of every 200 athletes. A certain meldonium test is 98% accurate: 98% of the time that meldonium is present in a sample, the test will correctly detect it, and 98% of the time that meldonium is absent from a sample, the test will correctly report the absence. An athlete is selected at random, and tests positive for meldonium. How likely is it that the athlete is actually using meldonium? M = {uses}, C = {doesn’t}, P = {tests positive}, N = {tests negative} P(M|P) = P(P|M)P(M) P(P|M)P(M) + P(P|C)P(C) = .0049 .0049 + .0199 = .1975 . . .
SLIDE 21
Drug testing example
Meldonium is estimated to be used by 1 out of every 200 athletes. A certain meldonium test is 98% accurate: 98% of the time that meldonium is present in a sample, the test will correctly detect it, and 98% of the time that meldonium is absent from a sample, the test will correctly report the absence. An athlete is selected at random, and tests positive for meldonium. How likely is it that the athlete is actually using meldonium? M = {uses}, C = {doesn’t}, P = {tests positive}, N = {tests negative} P(M|P) = P(P|M)P(M) P(P|M)P(M) + P(P|C)P(C) = .0049 .0049 + .0199 = .1975 . . . Suppose instead two independent samples test positive? (Event PP)
SLIDE 22
Drug testing example
Meldonium is estimated to be used by 1 out of every 200 athletes. A certain meldonium test is 98% accurate: 98% of the time that meldonium is present in a sample, the test will correctly detect it, and 98% of the time that meldonium is absent from a sample, the test will correctly report the absence. An athlete is selected at random, and tests positive for meldonium. How likely is it that the athlete is actually using meldonium? M = {uses}, C = {doesn’t}, P = {tests positive}, N = {tests negative} P(M|P) = P(P|M)P(M) P(P|M)P(M) + P(P|C)P(C) = .0049 .0049 + .0199 = .1975 . . . Suppose instead two independent samples test positive? (Event PP) P(M|PP) = P(PP|M)P(M) P(PP|M)P(M) + P(PP|C)P(C) = .004802 .004802 + .000398 = .923 . . .
SLIDE 23 Recall from last time
A random variable is a function that assigns a numerical value to each point in a sample space: X : S → R. If P is a probability function on the sample space, then for A a set of real numbers P(X ∈ A) = P({s ∈ S : X(s) ∈ A}). Running examples:
◮ Roll two dice, observe both numbers. X is sum of two numbers. ◮ Draw cards from deck with replacement until first club is drawn,
- bserve sequence of cards. Y is number of draws.
◮ Throw dart at random at radius 20cm dartboard, observe point. D
is distance from center of board.
SLIDE 24 Binomial pmf (a.k.a. Binomial distribution)
Bernoulli trial: Single trial, success probability p, failure probability 1 − p Random variable X records success or failure Mass function: pX(x) =
if x = 1 q if x = 0 X ∼ Ber(p) Binomial trial: n independent repetitions of Bernoulli trial, success probability p Random variable X records number of success Mass function: pX(x) = x
k
- pkqn−k, x = 0, 1, . . . , n
X ∼ Bin(n, p)
SLIDE 25 Test your intuition!
I have two cookie jars, initially with 40 cookies in each one. Each time I want a cookie, I pick a jar at random to take it from. When I first find a jar empty, which of these is most likely for the number
- f cookies in the other jar?
A: Lots: more than 32 B: Between 24 and 31 C: Between 16 and 23 D: Between 8 and 15 E: Not many: fewer than 8
SLIDE 26
Poisson process
Models the number of occurrences of a rare event, in unit time:
◮ Number of earthquakes per year in US ◮ Number of leap-year babies on campus (“time” interpreted liberally) ◮ Number of atoms in a sample of francium-223 that decay per minute ◮ ...
SLIDE 27
Poisson process
Models the number of occurrences of a rare event, in unit time:
◮ Number of earthquakes per year in US ◮ Number of leap-year babies on campus (“time” interpreted liberally) ◮ Number of atoms in a sample of francium-223 that decay per minute ◮ ...
Assumptions:
◮ Average number of occurrences per unit time known — λ ◮ Disjoint time periods are independent of each other ◮ Simultaneous occurrences very unlikely
SLIDE 28
Poisson process
Models the number of occurrences of a rare event, in unit time:
◮ Number of earthquakes per year in US ◮ Number of leap-year babies on campus (“time” interpreted liberally) ◮ Number of atoms in a sample of francium-223 that decay per minute ◮ ...
Assumptions:
◮ Average number of occurrences per unit time known — λ ◮ Disjoint time periods are independent of each other ◮ Simultaneous occurrences very unlikely
X = number of occurrences in unit time; possible values 0, 1, 2, 3, . . .
SLIDE 29
Poisson process
Models the number of occurrences of a rare event, in unit time:
◮ Number of earthquakes per year in US ◮ Number of leap-year babies on campus (“time” interpreted liberally) ◮ Number of atoms in a sample of francium-223 that decay per minute ◮ ...
Assumptions:
◮ Average number of occurrences per unit time known — λ ◮ Disjoint time periods are independent of each other ◮ Simultaneous occurrences very unlikely
X = number of occurrences in unit time; possible values 0, 1, 2, 3, . . . X has Poisson mass function; X ∼ Poi(λ) P(X = k) = e−λ λk k!
SLIDE 30 Expectation and variance
X a discrete random variable, range {x1, x2, . . .} Expectation: E(X) = µ = µ1 =:
xiP(X = xi)
SLIDE 31 Expectation and variance
X a discrete random variable, range {x1, x2, . . .} Expectation: E(X) = µ = µ1 =:
xiP(X = xi) Variance: Var(X) = σ2 =: E((X − E(X))2) =
(x2
i − µ)2P(X = xi)
= E(X 2) − E(X)2 = µ2 − µ2
1
SLIDE 32 Expectation and variance of common random variables
- 1. Uniform(1, . . . , n): µ = n+1
2 , σ2 = n2−1 12
SLIDE 33 Expectation and variance of common random variables
- 1. Uniform(1, . . . , n): µ = n+1
2 , σ2 = n2−1 12
- 2. Bernoulli(p): µ = p, σ2 = pq
SLIDE 34 Expectation and variance of common random variables
- 1. Uniform(1, . . . , n): µ = n+1
2 , σ2 = n2−1 12
- 2. Bernoulli(p): µ = p, σ2 = pq
- 3. Binomial(n, p): µ = np, σ2 = npq
SLIDE 35 Expectation and variance of common random variables
- 1. Uniform(1, . . . , n): µ = n+1
2 , σ2 = n2−1 12
- 2. Bernoulli(p): µ = p, σ2 = pq
- 3. Binomial(n, p): µ = np, σ2 = npq
- 4. Geometric(p): µ = 1
p, σ2 = q p2
SLIDE 36 Expectation and variance of common random variables
- 1. Uniform(1, . . . , n): µ = n+1
2 , σ2 = n2−1 12
- 2. Bernoulli(p): µ = p, σ2 = pq
- 3. Binomial(n, p): µ = np, σ2 = npq
- 4. Geometric(p): µ = 1
p, σ2 = q p2
- 5. NegativeBinomial(p, k): µ = k
p , σ2 = kq p2
SLIDE 37 Expectation and variance of common random variables
- 1. Uniform(1, . . . , n): µ = n+1
2 , σ2 = n2−1 12
- 2. Bernoulli(p): µ = p, σ2 = pq
- 3. Binomial(n, p): µ = np, σ2 = npq
- 4. Geometric(p): µ = 1
p, σ2 = q p2
- 5. NegativeBinomial(p, k): µ = k
p , σ2 = kq p2
- 6. Hypergeometric(r, g, n): µ =
nr r+g , σ2 = . . .
SLIDE 38 Expectation and variance of common random variables
- 1. Uniform(1, . . . , n): µ = n+1
2 , σ2 = n2−1 12
- 2. Bernoulli(p): µ = p, σ2 = pq
- 3. Binomial(n, p): µ = np, σ2 = npq
- 4. Geometric(p): µ = 1
p, σ2 = q p2
- 5. NegativeBinomial(p, k): µ = k
p , σ2 = kq p2
- 6. Hypergeometric(r, g, n): µ =
nr r+g , σ2 = . . .
- 7. Poison(λ): µ = λ, σ2 = λ
SLIDE 39
Some non-discrete random variables
◮ X is a random number between 0 and 1
range is all reals between 0 and 1 — [0, 1]
SLIDE 40
Some non-discrete random variables
◮ X is a random number between 0 and 1
range is all reals between 0 and 1 — [0, 1]
◮ Y is time until a call is answered
range is all reals greater than 0, plus ∞ — (0, ∞]
SLIDE 41
Some non-discrete random variables
◮ X is a random number between 0 and 1
range is all reals between 0 and 1 — [0, 1]
◮ Y is time until a call is answered
range is all reals greater than 0, plus ∞ — (0, ∞]
◮ Z is temperature 24 hours from now
range is all reals at least absolute zero — [−459.670, ∞)
SLIDE 42 Some non-discrete random variables
◮ X is a random number between 0 and 1
range is all reals between 0 and 1 — [0, 1]
◮ Y is time until a call is answered
range is all reals greater than 0, plus ∞ — (0, ∞]
◮ Z is temperature 24 hours from now
range is all reals at least absolute zero — [−459.670, ∞) Definition: X is a continuous random variable if there is some function f : R → [0, ∞) — the density function of X — such that for all real x P(X ≤ x) = x
−∞
f (t) dt (so the cdf of X — FX(x) = P(X ≤ x) — is continuous)
SLIDE 43 Finding the density of Y = g(X) from density of X
Step 1: Use the possible values of X to find the possible values of g(X) E.g., X ∼ Exp(1) has possible values (0, ∞), so Y = log(X) has possible values (−∞, ∞) For any values not possible for Y , density is 0
SLIDE 44 Finding the density of Y = g(X) from density of X
Step 1: Use the possible values of X to find the possible values of g(X) E.g., X ∼ Exp(1) has possible values (0, ∞), so Y = log(X) has possible values (−∞, ∞) For any values not possible for Y , density is 0 Step 2: Express P(Y ≤ x) as P(X in some range), by asking “where must X be, for g(X) to be at most x?” E.g., P(log X ≤ x) = P(X ≤ ex ) This is the step that usually requires some thinking
SLIDE 45 Finding the density of Y = g(X) from density of X
Step 1: Use the possible values of X to find the possible values of g(X) E.g., X ∼ Exp(1) has possible values (0, ∞), so Y = log(X) has possible values (−∞, ∞) For any values not possible for Y , density is 0 Step 2: Express P(Y ≤ x) as P(X in some range), by asking “where must X be, for g(X) to be at most x?” E.g., P(log X ≤ x) = P(X ≤ ex ) This is the step that usually requires some thinking Step 3: Use the density function of X, together with the result of Step 2, to get the cdf FY of Y , for all values that Y can possible take E.g., FY (x) = P(X ≤ ex ) = ex e−t dt = []ex
t=0 = 1 − ee−x
For all values below the smallest possible value of Y , the cdf is 0; for all values above the largest possible value, it is 1
SLIDE 46 Finding the density of Y = g(X) from density of X
Step 1: Use the possible values of X to find the possible values of g(X) E.g., X ∼ Exp(1) has possible values (0, ∞), so Y = log(X) has possible values (−∞, ∞) For any values not possible for Y , density is 0 Step 2: Express P(Y ≤ x) as P(X in some range), by asking “where must X be, for g(X) to be at most x?” E.g., P(log X ≤ x) = P(X ≤ ex ) This is the step that usually requires some thinking Step 3: Use the density function of X, together with the result of Step 2, to get the cdf FY of Y , for all values that Y can possible take E.g., FY (x) = P(X ≤ ex ) = ex e−t dt = []ex
t=0 = 1 − ee−x
For all values below the smallest possible value of Y , the cdf is 0; for all values above the largest possible value, it is 1 Step 4: Differentiate the cdf of Y to find the pdf of Y for all values that Y can possible take E.g., fY (x) =
d dx
= e−x ee−x