SLIDE 6 6
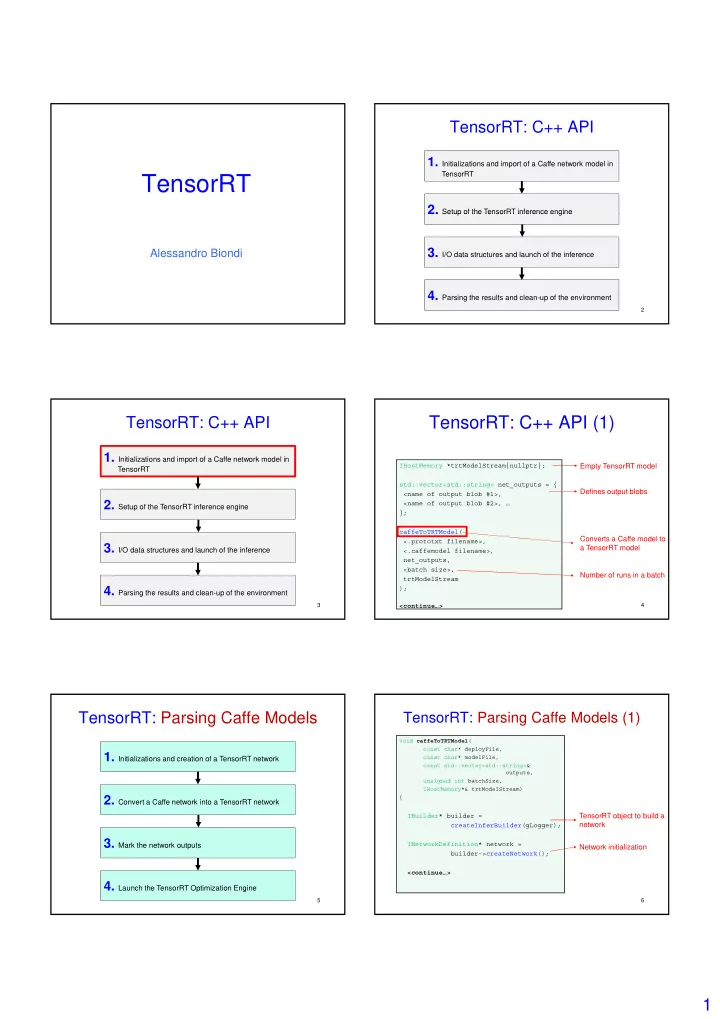
Profiling with TensorRT
struct Profiler : public IProfiler { <…> void printLayerTimes() { float totalTime = 0; for (size_t i = 0; i < mProfile.size(); i++) 31 { printf("%-40.40s %4.3fms\n", mProfile[i].first.c_str(), mProfile[i].second); totalTime += mProfile[i].second; } printf("Time over all layers: %4.3f\n", totalTime); } } gProfiler;
TensorRT: C++ API (2) – with profiler
IRuntime* runtime = createInferRuntime(gLogger); ICudaEngine* engine = runtime->deserializeCudaEngine(
32
trtModelStream->data(), trtModelStream->size(), NULL ); IExecutionContext* context = engine->createExecutionContext(); context->setProfiler(&gProfiler);
The profiler can be attached to a TensorRT execution context
Profiling with TensorRT
Layer1 + Layer1_relu 3.159ms Layer2 0.652ms Layer3_block_0 + Layer3_block_0_relu 1.638ms Layer3_block_1 + Layer3 + Layer3_relu 1.731ms Layer4_block_0 + Layer4_block_0_relu 1.660ms Layer4_block_1 + Layer4 + Layer4_relu 1.822ms Layer5_block_0 + Layer5_block_0_relu 1.248ms Layer5_proj_block 0.241ms Layer5_block_1 + Layer5 + Layer5_relu 1.576ms Layer6 block 0 + Layer6 block 0 relu 1 564ms
Layers merged by TensorRT
33
Layer6 block 0 + Layer6 block 0 relu 1.564ms Layer6_block_1 + Layer6 + Layer6_relu 1.652ms Layer7_block_0 + Layer7_block_0_relu 1.266ms Layer7_proj_block 0.194ms Layer7_block_1 + Layer7 + Layer7_relu 1.831ms Layer8_block_0 + Layer8_block_0_relu 2.732ms Layer8_block_1 + Layer8 + Layer8_relu 2.999ms Layer9_block_0 + Layer9_block_0_relu 3.515ms Layer9_proj_block 0.636ms Layer9_block_1 + Layer9 + Layer9_relu 9.899ms Layer10_block_0 + Layer10_block_0_relu 6.807ms Layer10_block_1 + Layer10 + Layer10_relu 6.754ms Layer11_bbox 0.139ms <…>
Compiling a TensorRT Application
typical C++ application developed with the TensorRT API requires to be linked to the following dynamic libraries:
– nvparsers, nvinfer, cudart, pthread
- The Nvidia libraries are available within the CUDA
and TensorRT folders e g
34
and TensorRT folders, e.g.,
– /usr/local/cuda/lib/ and /tensorrt/TensorRT- 4.0.1.7/lib64/ on a standard configuration of the Jetson
TX2
- CUDA and TensorRT headers are also available
within their folders, e.g.,
– /usr/local/cuda/include/ and /tensorrt/TensorRT- 4.0.1.7/include/ on a standard configuration of the
Jetson TX2
Example Makefile
APP := my_app CC := g++ CUDA_INSTALL_PATH ?= /usr/local/cuda TRT_INSTALL_PATH ?= /tensorrt/TensorRT-4.0.1.7 SRCS := my_app.cpp OBJS := $(SRCS:.cpp=.o) CPPFLAGS := -std=c++11 -I"$(TRT INSTALL PATH)/include" \ CPPFLAGS : std c++11 I $(TRT_INSTALL_PATH)/include \
- I"$(CUDA_INSTALL_PATH)/include"
LDFLAGS := -lnvparsers –lnvinfer –lcudart -pthread \
- L"$(TRT_INSTALL_PATH)/lib" \
- L"$(CUDA_INSTALL_PATH)/lib64"
all: $(APP) %.o: %.cpp @ $(CC) $(CPPFLAGS) -c $< $(APP): $(OBJS) @ $(CC) -o $@ $(OBJS) $(CPPFLAGS) $(LDFLAGS) clean: rm -rf $(APP) $(OBJS)
35
Off-line Profiling Tools
- Nvidia offers two interesting tools to enable a fine-grained profiling of
- f
computational activities
GPUs, which are hence also particularly useful to profile the execution of DNNs – Visual profiler: is a graphical profiling tool that displays a timeline
- f your application's CPU and GPU activity, and that includes an
automated analysis engine to identify optimization opportunities.
36
– Nvprof: is a run-time tool that allows collecting and viewing profiling data from the command-line
- Typical usage:
- 1. Collect profiling data at run-time with nvprof
- 2. Export the profiling data
- 3. Import the data in the Visual profiler for a graphical representation
Warning: these two tools will be integrated in a new tool named Nvidia Nsight Compute