
SLIDE 1
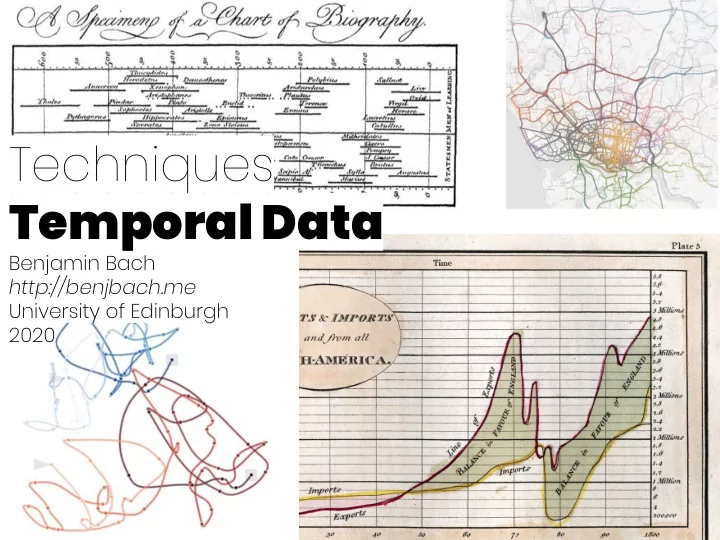
Techniques Temporal Data
Benjamin Bach http://benjbach.me University of Edinburgh 2020
Techniques Temporal Data Benjamin Bach http://benjbach.me - - PowerPoint PPT Presentation
Techniques Temporal Data Benjamin Bach http://benjbach.me University of Edinburgh 2020 Events Trajectories Calendar Time series Tasks Min, max values, specific values Trends and outliers Change and rate of change
Benjamin Bach http://benjbach.me University of Edinburgh 2020
Calendar Events Trajectories Time series
values
change
that may influence the data
time series
https://waitbutwhy.com/2014/05/life-weeks.html
https://www.writerscafe.org/writing/TheoLueck/1416170/
https://ieeexplore.ieee.org/stamp/stamp.jsp?arnumber=6065014
https://www.perceptualedge.com/articles/guests/intro_to_cycle_plots.pdf
https://www.perceptualedge.com/articles/guests/intro_to_cycle_plots.pdf
https://www.perceptualedge.com/articles/guests/intro_to_cycle_plots.pdf
numerical values + Row and column effects + Easy look up + Space efficient
comparison hard
https://www.writerscafe.org/writing/TheoLueck/1416170/
Heer, Jeffrey, Nicholas Kong, and Maneesh Agrawala. "Sizing the horizon: the effects of chart size and layering on the graphical perception of time series visualizations." Proceedings of the SIGCHI conference on human factors in computing systems. 2009.
https://statmodeling.stat.columbia.edu/2013/06/12/how-to-best-graph-t he-beveridge-curve-relating-the-vacancy-rate-in-jobs-to-the-unemploy ment-rate/
Inefficient labour market
https://statmodeling.stat.columbia.edu/2013/06/12/how-to-best-graph-t he-beveridge-curve-relating-the-vacancy-rate-in-jobs-to-the-unemploy ment-rate/
Recessions!
Moritz Stefaner: http://truth-and-beauty.net/projects/remixing-rosling/
Kim, Nam Wook, et al. "Visualizing nonlinear narratives with story curves." IEEE transactions on visualization and computer graphics 24.1 (2017): 595-604.
Bach, Benjamin, et al. "Time curves: Folding time to visualize patterns of temporal evolution in data." IEEE transactions on visualization and computer graphics 22.1 (2015): 559-568.
Bach, Benjamin, et al. "Time curves: Folding time to visualize patterns of temporal evolution in data." IEEE transactions on visualization and computer graphics 22.1 (2016).
+ Amount of change + Signatures + Comparison
projection
Charles Joseph Minard (1781-1870)
Kraak, Menno-Jan. "The space-time cube revisited from a geovisualization perspective." Proc. 21st International Cartographic
Ilägcrstrand, Torsten. "What about people in regional science?." Papers
Cutting plane Mouse access "Poke"-access Cutting plane Transparency + bending Opening
Joseph Minard
Thudt, Alice, Dominikus Baur, and Sheelagh Carpendale. "Visits: A Spatiotemporal Visualization of Location Histories." EuroVis (Short Papers). 2013.
+ Compare regions + Look-up regions + Details on regions
https://vita.had.c
ph-maps.pdf
+ Compare regions + Look-up regions + Details on regions
https://gis.stackexchange.com/ques tions/202882/create-space-time-cu be-in-arcgis-for-desktop
Andrienko, G., Andrienko, N., Schumann, H., & Tominski, C. (2014). Visualization of trajectory attributes in space–time cube and trajectory wall. In Cartography from Pole to Pole (pp. 157-163). Springer, Berlin, Heidelberg.
Bach, Benjamin, et al. "A descriptive framework for temporal data visualizations based on generalized space‐time cubes." Computer Graphics Forum. Vol. 36. No. 6. 2017.
https://www.youtube.com/watch?v=dZN2ICTRWBU
8: Revealing Change
time-oriented data. Springer Science & Business Media, 2011.
framework for temporal data visualizations based on generalized space‐time cubes." Computer Graphics
Cartographies of time: A history of the
2013.