
SLIDE 1
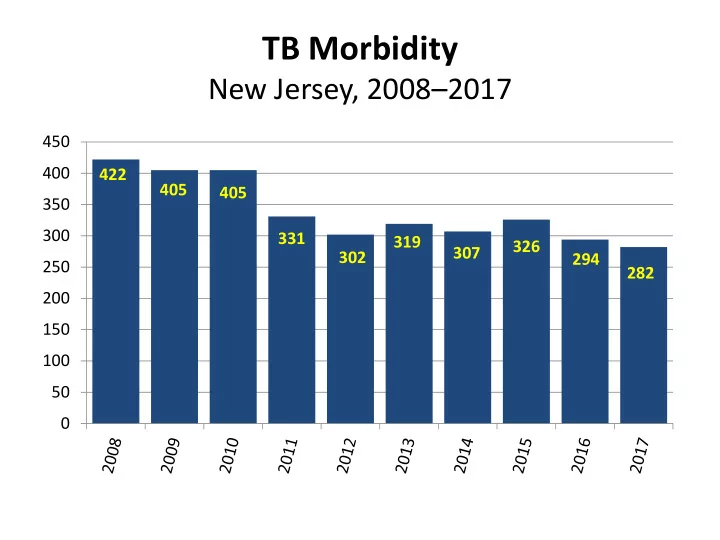
TB Morbidity
New Jersey, 2008–2017
422 405 405 331 302 319 307 326 294 282 50 100 150 200 250 300 350 400 450
TB Morbidity New Jersey, 20082017 450 400 422 405 405 350 300 - - PowerPoint PPT Presentation
TB Morbidity New Jersey, 20082017 450 400 422 405 405 350 300 331 319 326 307 302 294 250 282 200 150 100 50 0 TB Morbidity by Race/Ethni city New Jersey, 20082017 200 150 100 50 Asian Black Hispanic White 0
422 405 405 331 302 319 307 326 294 282 50 100 150 200 250 300 350 400 450
50 100 150 200 Asian Black Hispanic White
2008 2009 2010 2011 2012 2013 2014 2015 2016 2017 Asian
168 143 154 112 145 121 137 146 125 144
Black
77 89 86 71 47 55 43 48 49 42
Hispanic
128 126 123 105 79 109 103 105 98 70
White
49 44 41 43 31 34 24 27 22 26
97 95 102 82 49 66 56 60 60 46 325 310 302 249 302 253 251 253 251 236 50 100 150 200 250 300 350 400 450 2008 2009 2010 2011 2012 2013 2014 2015 2016 2017 TB Cases US Born Foreign-Born
Foreign-born US Born
County 2008 2009 2010 2011 2012 2013 2014 2015 2016 2017 Atlantic 19/7.0 14/5.2 12/4.4 8/2.9 9/3.3 10/3.6 9/3.2 13/4.7 5/1.8 6/2.2 Bergen 44/4.9 37/4.0 43/4.8 29/3.2 38/4.2 37/3.9 29/3.1 35/3.7 30/3.2 13/1.4 Burlington 5/1.1 7/1.6 15/3.3 10/2.2 12/2.7 7/1.6 4/0.9 11/2.4 4/0.9 8/1.8 Camden 19/3.7 15/2.9 10/1.9 12/2.3 10/2.0 15/2.9 11/2.1 11/2.2 12/2.3 11/2.2 Cape May 2/2.0 1/1.0 2/2.1 3/3.1 2/2.1 2/2.1 0/0.0 2/2.1 1/1.1 1/1.1 Cumberland 4/2.6 8/5.1 6/3.8 5/3.2 5/3.2 7/4.4 4/2.5 10/6.4 8/5.1 9/5.9 Essex 71/9.1 59/7.7 54/6.9 47/6.0 40/5.1 52/6.7 33/4.2 39/4.9 41/5.1 35/4.4 Gloucester 4/1.4 5/1.7 7/2.4 4/2.4 0/0.0 1/0.6 3/1.0 3/1.0 5/1.7 4/1.4 Hudson 54/9.0 69/11.5 51/8.0 44/6.9 38/5.9 59/9.0 52/7.9 51/7.6 48/7.1 50/7.4 Hunterdon 2/1.5 2/1.5 2/1.6 2/1.6 0/0.0 1/1.0 0/0.0 4/3.2 0/0.0 4/3.2 Mercer 11/3.0 16/4.4 16/4.4 13/3.5 9/2.5 12/3.3 13/3.5 20/5.4 15/4.0 13/3.5 Middlesex 60/7.6 52/6.6 65/8.0 48/5.9 59/7.2 31/3.8 57/6.9 53/6.3 44/5.2 48/5.7 Monmouth 21/3.3 14/2.2 15/2.4 11/1.7 6/0.9 12/2.0 8/1.3 9/1.4 11/1.7 9/1.4 Morris 14/2.9 11/2.3 7/1.4 15/3.0 9/1.8 12/2.4 8/1.6 9/1.8 8/1.6 11/2.2 Ocean 6/1.1 9/1.6 17/2.9 15/2.6 7/1.2 8/1.4 18/3.1 9/1.5 9/1.5 10/1.7 Passaic 29/5.9 28/5.7 32/6.4 24/4.8 20/4.0 25/5.2 21/4.2 11/2.2 18/3.5 19/3.7 Salem 1/1.5 3/4.5 2/3.0 0/0 1/1.5 0/0 1/1.5 2/3.1 0/0.0 0/0.0 Somerset 16/4.9 17/5.2 14/4.3 9/2.8 13/4.0 6/1.8 15/4.5 9/2.7 6/1.8 10/3.0 Sussex 1/1.0 2/1.3 1/0.7 1/0.7 2/1.3 3/2.0 0/0.0 0/0.0 1/0.7 0/0.0 Union 39/7.4 33/6.3 34/6.3 31/5.8 21/4.0 18/3.3 20/3.8 24/4.4 26/4.7 19/3.4 Warren 0/0.0 3/2.7 0/0.0 0/0.0 1/0.9 1/1.0 1/0.9 1/0.9 2/1.9 2/1.9 State Total 422/4.9 405/4.7 405/4.6 331/3.8 302/3.4 319/3.6 307/3.5 326/3.7 294/3.3 282/3.2
*Cases per 100,000 population Data Source: US Census Bureau Population estimates, July 1, 2017
≥ 200 100‒199 50‒99 20‒49 < 20
ESSEX ATLANTIC BURLINGTON BERGEN BURLINGTON CAMDEN
CAPE
MAY CAPE MAY GLOUCESTER HUNTERDON MERCER MIDDLESEX MONMOUTH MONMOUTH MORRIS OCEAN OCEAN Passaic PASSAIC SALEM SOMERSET SOMERSET SUSSEX UNION UNION WARREN CUMBERLAND HUDSON
City 2008 2009 2010 2011 2012 2013 2014 2015 2016 2017 Edison
11/11.0 10/10.0 15/15.0 11/11.0 16/15.9 8/7.9 10/9.8 11/10.8 7/6.8 10/9.8
Elizabeth
16/12.8 8/6.4 12/9.6 14/11.2 8/6.4 11/8.7 10/7.8 12/9.3 11/8.5 12/9.3
Jersey City
39/16.0 43/17.7 33/13.3 21/8.5 28/11.2 34/13.4 34/13.0 29/11.1 31/11.3 32/3.5
Newark
36/12.9 27/9.7 25/9.0 20/7.2 20/7.2 28/10.1 14/5.0 19/6.8 20/7.0 10/3.5
Paterson
15/10.2 15/10.3 12/8.2 12/8.2 12/8.2 5/3.4 12/8.2 6/4.1 1/0.7 12/8.2
*Cases per 100,000 population Data Source: US Census Bureau Population estimates, July 1, 2017
50 100 150 200 0–4 5–14 15–24 25–44 45–64 ≥ 65 Age 2008 2009 2010 2011 2012 2013 2014 2015 2016 2017 0–4 2 9 15 7 1 9 7 8 6 9 5–14 7 5 12 7 4 4 6 2 5 8 15–24 42 57 44 35 24 27 35 32 30 26 25–44 176 168 139 124 124 108 126 109 91 90 45–64 122 97 111 86 86 100 81 87 88 90 ≥ 65 73 69 84 72 64 71 52 88 74 59
5 10 15 20 25 2008 2009 2010 2011 2012 2013 2014 2015 2016 2017 28 18 20 16 16 18 20 7 12 8
2.8% 5.2% 4.4% 4.9% 4.8% 5.3% 5.6% 6.5% 2.1% 4.1% 50 100 150 200 250 300 350 400 450 2008 2009 2010 2011 2012 2013 2014 2015 2016 2017 TB Cases All Other HC Workers
5 10 15 20 25 30 35 2008 2009 2010 2011 2012 2013 2014 2015 2016 2017 33 26 27 25 17 23 14 16 15 15
5.3% 7.8% 7.2% 7.2% 7.3% 5.6% 7.5% 4.6% 4.9% 5.1% 50 100 150 200 250 300 350 400 450 2008 2009 2010 2011 2012 2013 2014 2015 2016 2017 TB Cases All other HIV Co-infection
County 2008 2009 2010 2011 2012 2013 2014 2015 2016 2017 Atlantic Bergen 1 2 1 1 1 1 Burlington Camden Cape May Cumberland Essex 3 4 1 1 1 Gloucester Hudson 3 2 3 2 1 2 1 Hunterdon Mercer 1 Middlesex 3 3 1 2 1 2 Monmouth Morris 1 Ocean 1 1 1 Passaic 3 1 2 1 Salem Somerset 1 Sussex 1 Union 1 Warren State Total 8 9 8 8 4 5 4 4 3 3