~ ~ · -· • • ~ ~':'.:~rlr ~, ,.,._ · -· -~ ·"'"' <U~ q. <T~ ' )~'• r"f' ~ ~ x- = {g~ ~rm._ olfriri-ID>and ~ ~ t 9/7/2011 Fox Canyon Groundwater Today Management Agency • Discuss some background on why the IE Grower Meeting-- September 8, 2011 program was modified • Introduction to the new irrigation Allowance Program Irrigation Training and Research Center • Some issues that are being investigated California Polytechnic State University, San Luis Obispo (Cal Poly) • Future modifications likely with Grower Input Dr. Stuart Styles, P.E. Director, ITRC Dr. Dan Howes, P.E. Senior Engineer, ITRC : ]]!(: . = 2010 -ITRC Investigated the IE Old FCGMA IE Program Program for FCGMA • Strengths • Task 2.1-Analysis and annual plant -Attempts to account for regional and year to year required water values for crops in the differences in allowable water computations FCGMA -Simple methodology • Task 2.2- Evaluation of strengths and • Weaknesses weaknesses of the existing FCGMA IE -Too simple. Based on 3 crop categories while there are dozens of different crop types grown in program and specific suggestions for FCGMA improvement -Historically weather data utilized has had quality issues 
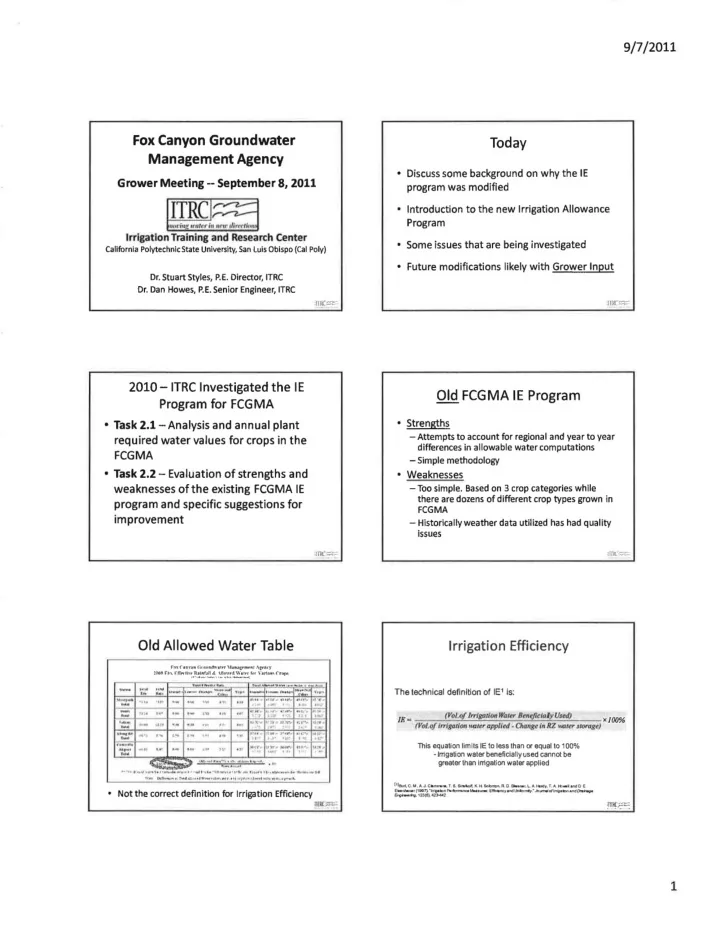
Old Allowed Water Table Irrigation Efficiency FnxC•nnullofnltnlh\ · •ttr"'ll'lt£"lnl'fll .\l:fii'T :oo• rtn. r.r,.,-th·~.~ . . nrtn•' Crllfd The technical definition of IE 1 is: JE c (Vol.o /lrrl ga rionWol4r B.n@cl ol yUm J) xJOO% ., ,,. ,,. 1':.0 tits"• tH ''..- ll1 f' ' in RZ 11 a1t, JI DI'QS•) :• (V <>i . of lf7'lgatiOII•"'II!r a pjJ /I td- Cf,~, J' U .., ol o -o,. It l l"" I II" 'I• " I' til" This equa ti on limits IE to less than Of equal to 100% -Irrigation water beneficially used cannot be greater than irrigation water applied ...... • •• _.. .. ., .. .. ... . ~· ...... .. .. ,.. • • ,, •• _ ., ..,..,.._ Jor ,_...._ •• .. _ ... .. ..... -· .. t -.:- .. j . .. .. .Ll ... [I[Bln'I.C. U ,AJ. C T.6. Sl 111"ool K. H. S..lomln.R.O a...,.. r, L A. Hi fdy, i . A..H:> - • andD E EIM...,_UII , [ 1Q!II7). "t19i llln "- rfvnw. rocto t.-.1urw : Emc. no!y 8 ndlklb"*f ." .h ..... • Not the correct definition for Irrigation Efficiency .... '*'o- 123{6 ). 423-442 1
_.;.A:~P~P:Ii:.:e.:d.;W.:.:a:.:t:.e:.r 9/7/2011 Irrigation Allowance Index Formula General Recommendations • Simple Ratio • Abandon FCGMA IE -Improper computation of IE and other issues _ • Replace with new Irrigation Allowance Irrigation Allowance Index = -: Irrigation Allowance Program- More Accurate Assessment of ET -Increased number of crop categories (24+) Values less than or equal to 1 are ideal -Multiple cropping {double and triple cropping) -Perennial crop age (canopy coverage) considered -Utilize 3 ETo Zones Ill >= Irrigation Allowance Includes Recommended FCGMA ET 0 Zones • Evapotranspiration of Irrigation Water • Zone 1 (Zl)- • Includes Santa Ana Winds Oxnard CIMIS and FCGMA Etting Road • Irrigation water for salinity management Station • Water to overcome a reasonable irrigation • Zone 2 {Z2)- Camarillo CIMIS and system distribution non-uniformity (DU = 0.8 FCGMA Camarillo Airport Station is reasonable in FCGMA) • Irrigation water for frost protection • Zone 3 (Z3)- Santa Paula CIMIS and FCGMA Moorpark /"/galion Al/ommce• Growing Period ET,. Station ((DU +Localized Deep Perc.on Drip) x (/- LR)) Use CIMIS as primary and FCGMA station as backup Salinity Management Salinity Management • Assumed average basin wide ECw = 1.8 dS/m • Value is high but common in some areas • Research underway on strawberries and ..... j already conducted on tomatoes show drip I I influences salinity management i I • Utilized the most resent research to estimate I water needed for salinity management • May need to be fine tuned as additional information becomes available '· " 2
4~ ~ ·~ I ~IC ~ -:, ~ \!1/W.,.tM.- M hS~ 9/7/2011 DRAFT Irrigation Allowance . ' New Allowance Program :::. T- ., .... I l.dO"- ... ..., _"? , .. ;, a • n 1) ¥ & l I • U II • Single value for each ETo Zone dependent on u+ n .. rainfall during the year- From CIMIS 1 t • ' • .. .. ,n . . .. • 3 year types- Wet, Dry, and Typical n ,. u a 1 ' . - Determined through examining modeled effective .. .. precipitation vs. total precipitation from 2000- 2009. General trends existed allowing grouping "*" into the 3 categories. "11 :ti 1'1 l'l I " 1 . . Precipitation w n n • • R .. Year Type Rance JJ nchest ... p ., 0 Typical 11- 17 w u n u M ...U..!:f.-:f.- " Dry <11 -f,- Wet >17 'lf i! 'Z' ft P't ... . ...... .. .. IN MI , Year Type Selection Continue to Utilize Weather Stations ... 14 iu '"""" WOI • 3 ETo Zones each with 2 weather stations . • • • ~ J• o • CIMIS station is primary ' t .. ... • FCGMA weather stations are backup .. 8 ' .. • I • • Collect ETo as a check ! 4 • "' • Collect precipitation data for year type l 1 , """" "'"<~"~ • l a Airou4o· men- selection I 0 • County precipitation gauges can be used as a 00 50 10 .0 150 20 0 250 30 0 check as well. Annu.l Pr.clptt.tlon (lnct.s) Comparison of Allowed Water and Irrigation Allowance Improving Weather Station Site Conditions • All weather stations should look similar to: Camarillo Santa Paula CIMIS CIMIS 3
~20% ~, '-' " ( '-' "' . = ~lit ~ -' •~ StmwMIJYW n • t-.tA,.au,t~o"Co"'pulto 9/7/2011 Important Improvements with Proposed Allowance Values Compared to Several Strawberry Grower Applied Water Values Irrigation Allowance Program [TolP e l • For some crops the New Irrigation Allowance does not differ much from the original FCGMA values • Key differences- -Canopy coverage (orchard age and thinning considerations) -Differentiating single, double and triple cropping --· ._.,, ·-· llll = COrn ,p•riNn of N•w Albwanc. ~ ~ and tt&tork..t IE ._.. klllot 1. 40 -r-- --'- '• ...;. • Difficulties >00 ...;.7 _,_ (DI ....; YI .:;_ • :109 .;._; ;_ ' •nfl -'-- 10 '-' lO ..:... CW. _ • ;_ l ----. 1.20 • Vegetated vs . Total Farm Acreage 1. 00 • Canopy coverage/orchard age 0. 80 - Requires grower estimates 0 . 60 -To confirm estimates it is recommended that 0. 40 growers submit an aerial photo of farm from 0.20 . . . Google/Yahoo/Bing maps .. -Aerial should be no more than 2-3 years old 0.00 0.20 0. 40 0. 60 0. 80 1. 00 1. 20 1.40 Norm•Hredlnverseof FCGMAIE {Fraction) ""SO% Cover Canopy Coverage Cover 4
lil -~' ~ -. ~ .-.;oy~ ~ · ~';l.;/1.-, ,.,.~ ~ 9/7/2011 "'SO% Cover "'70% Cover or More .... , • ~ -. . .• • . •• . ,-..;t:., • .• :1 .' ., ,'·.' ..... ·· -· · ...... .. ~ Difficulties (cont.) • Nursery and Sod Farms -Irrigation Allowance values are for full canopy or vegetative cover -However, at any time only 50-90% (or less) of the area may be cropped. - Need growers to provide estimates of the average vegetative area on an annual basis. -May need further refinement with additional studies. Sod lilt - 5
9/7/2011 Greenhouses and Tunnels Example- 3 Strawberry Growers • Crop- Strawberries • Used information from grower survey and • Zone- 1 published data to estimate growing period • Rainfall year= typical ETiw in greenhouses and tunnels Growerl Grower 2 Growet 3 • Best ava ilable information: I lndles Inches lndles 41.3 33.6 25.3 Applied Water - However, many different methods of greenhouse Allowed Water Estimate 37 37 37 operation. I Al l owance: I ndex 1.U 0. 91 0.68 -Should be refined with more detailed evaluation of greenhouses in FCGMA (outside of the scope of this evaluation) Example Calculation ·Irrigation Allowance Index= 41.3 in/37in = 1-12 Cu rr e nt DRAFT Irrigation Allowance Summary • The proposed Irrigation Allowance Program provides J " significant enhancements with minimal increase in .. . f.- .. .-'!.... complexity • Different than the original FCGMA Allowed Water which had no fundamental basis other than ET 0 '* I The Irrigation Allowance values include ET of irrigation n u u water, water for salinity management, and distribution uniformity ._ u n .. " " .,. The values are not "FINAL''. We will be examining them . .... . ,. ' .u u .u aJ for the first year of the program and updating where u "' tl .. Q necessary. Ji ll. = Thank You Questions?? 6
Recommend
More recommend