
SLIDE 1
Su mitom
- Trust & Banking
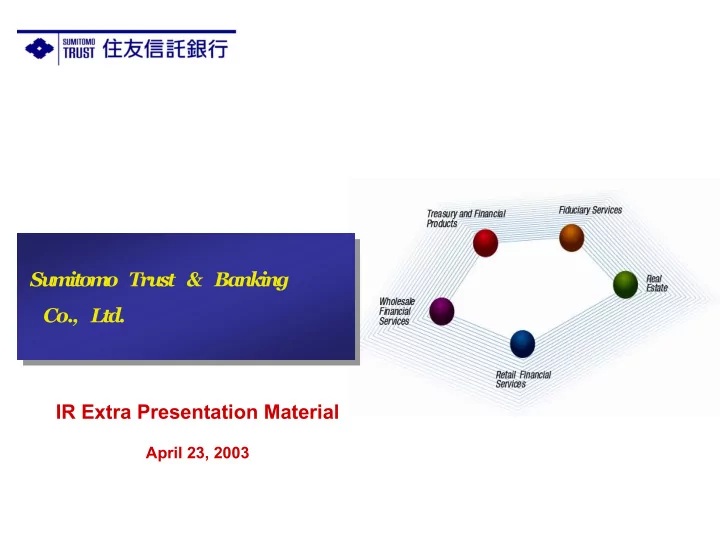
Su mitom o Trust & Banking Co., Ltd. IR Extra Presentation - - PowerPoint PPT Presentation
Su mitom o Trust & Banking Co., Ltd. IR Extra Presentation Material April 23, 2003 Table of Contents Historical Data ----- 2-3 Misconceptions ----- 4 Loan portfolio by Industry ----- 5-8 Jumping-off Point for Discussion ----- 9
(in billions of Yen)
(Preliminary)
Doubtful (1) Substandard (2) Bankrupt / Practically Bankrupt (3) (1+2+3) / Total Assets (%)
(in billions of Yen)
* Net Business Profit before Credit Costs = Net Business Profit + Trust Account Credit Cost + Net Transfer to General Reserve ** Preliminary Number for 03/03
Reduction : Housing Loan Companies + Sumitomo Trust’s Affiliates + Independent + Bank-affiliates = approx. 1,600 billion yen Increases:Government-affiliated + Securitization + Consumer Credit + Trading Company-affiliated = approx. 1,000 billion yen
Others Securities Firms Government-affiliated
Aggregate amount of loans with exposure in excess of 3 billion yen
Housing Loan Companies
19%
Sumitomo Trust’s affiliates
13%
Trading Company- affiliated
1%
Consumer Credit
4%
Independent
Sumitomo Group Financial Institutions
7%
Manufacturing-affiliated
10%
Bank-affiliated
15% 1% 4% 3%
Coverage Ratio: 92%
11% 17% 15%
Bridge Loans for Securitization
14% 11%
10%
9% 6%
Others 4% 1% 1%
Coverage Ratio: 96%
Sumitomo Group Financial Institutions Government
Independent Consumer Credit Manufacturing
Trading Company
Securities firms
Aggregate amount of loans with exposure in excess of 3 billion yen
Sumitomo Trust’s affiliates Bank-affiliated REIT 1%
Reduction: Leasing + Other Services + Others = approx. 970 billion yen Increases: Governmental Institutions + Rental = approx. 100 billion yen
2% 1% Others 10% 16%
Including Sumitomo Trust’s affiliates 102.4 billion yen
Leasing 71% Other Services
Rental (unregistered for financial business)
1,973.2 billion yen
Coverage Ratio: 81% Aggregate amount of loans with exposure in excess of 3 billion yen
Bridge Loans for Securitization (Shipping Sector) , Japan Trustee Information Systems, Japan TA Solutions, etc Hotels and Lodging Governmental Institutions, etc Governmental Institutions 4% Hotels and Lodging 3% Rental (unregistered for financial business)
7% Other Services 15% Leasing 70%
Hospitals 1%
1,103.2 billion yen
Coverage Ratio: 76% Aggregate amount of loans with exposure in excess of 3 billion yen
Reduction : Independent + Bank-affiliated + Manufacturing-affiliated + Trading Company-affiliated = approx. 590 billion yen Increases: Sumitomo Trust’s affiliated = approx. 40 billion yen
3%
36% 25% Independent Bank-affiliated Manufacturing
17%
Trading Company
14% 5% Sumitomo Trust’s affiliates Insurance-affiliated
1,325.8 billion yen
Aggregate amount of loans with exposure in excess of 3 billion yen 1% Independent 10% 11% 16% Sumitomo Trust’s affiliates 13% Bank
44% Insurance-affiliated 5%
Trading Company
Manufacturing
779 billion yen
Coverage Ratio: 91% Aggregate amount of loans with exposure in excess of 3 billion yen Others
Reduction: General Trading Companies + Department Stores and Supermarkets = approx. 180 billion yen Increases: various = approx. 30 billion yen
Wholesale of machinery and tools
2%
Wholesale of construction / industrial material
7%
Department Stores and Supermarkets
15%
General Trading Companies
54% 7%
her Wholesale
4%
1%
70% to Top Tier (5 cos) Retail other than Department Stores / Supermarkets
10%
Wholesale of food and beverage
6%
Trading Companies
“General Trading Companies”
627.9 billion yen
Coverage Ratio: 70%
Aggregate amount of loans with exposure in excess of 3 billion yen
Wholesale of construction / industrial material W
17% 17%
62%
3%
General Trading Companies Department Stores and Supermarkets
Other Wholesale
783.1 billion yen
Coverage Ratio: 66%
Aggregate amount of loans with exposure in excess of 3 billion yen 1%
holesale of food and beverage Ot Textile and Apparel
(Billions of Yen) <Sumitomo Trust> Mar-85 Mar-86 Mar-87 Mar-88 Mar-89 Mar-90 Mar-91 Mar-92 Mar-93 Sep-02 Domestic Total 6,455.7 7,240.2 8,397.2 8,796.5 9,299.5 10,060.3 11,468.8 11,901.5 12,607.9 10,465.3 Manufacturing 1,377.7 1,351.5 1,306.3 1,146.8 1,022.4 922.9 1,289.6 1,368.5 1,452.9 1,498.3 Construction 193.6 205.4 216.3 208.2 227.5 203.8 220.0 262.5 314.8 248.3 Energy and Utilities 417.9 422.0 420.5 420.3 417.2 412.4 414.8 411.7 410.0 244.9
Transportation and Communication
547.3 569.6 581.2 556.1 537.0 607.6 675.8 664.3 709.6 1,005.2
Wholosale, Retail and Restaurant
655.5 640.0 756.0 631.8 663.3 735.9 1,050.7 1,198.1 1,171.0 895.3 Finance and Insurance 853.8 1,081.1 1,491.1 2,115.1 2,569.4 2,811.2 2,859.9 2,905.9 3,120.1 2,388.3 Real Estate 770.0 1,021.0 1,415.1 1,393.9 1,409.7 1,497.1 1,530.4 1,546.5 1,611.0 1,259.8 Services 723.1 972.3 1,195.8 1,357.4 1,479.1 1,795.0 2,171.3 2,252.2 2,419.6 1,446.2 Overseas 900.2 917.9 1,068.1 1,195.2 1,474.0 2,330.4 1,857.5 1,786.4 1,579.6 414.9 Total 7,355.9 8,158.1 9,465.3 9,991.7 10,773.5 12,390.7 13,326.3 13,688.0 14,187.5 10,880.1 <Trust Bank A> Mar-85 Mar-86 Mar-87 Mar-88 Mar-89 Mar-90 Mar-91 Mar-92 Mar-93 Sep-02 Domestic Total 6,656.4 7,509.4 8,400.0 8,806.6 9,298.5 10,221.0 11,417.2 11,555.1 12,157.5 9,363.8 Manufacturing 1,376.7 1,356.8 1,219.9 1,072.6 923.8 835.7 1,240.9 1,247.9 1,356.6 1,271.9 Construction 171.8 204.0 228.6 230.4 225.1 200.3 227.1 287.5 334.7 306.0 Energy and Utilities 420.1 422.9 421.5 418.8 412.7 402.6 403.7 403.4 401.4 279.6
Transportation and Communication
477.8 501.6 521.2 572.9 580.4 641.4 706.2 739.4 776.8 928.8
Wholosale, Retail and Restaurant
622.1 622.1 627.8 603.5 656.4 664.1 880.8 856.0 816.7 816.2 Finance and Insurance 888.2 1,125.5 1,593.9 1,860.0 2,184.0 2,671.8 2,879.2 2,777.6 2,874.9 2,255.4 Real Estate 797.2 1,087.3 1,405.4 1,454.8 1,501.5 1,609.2 1,606.3 1,656.4 1,949.8 1,272.0 Services 818.8 1,056.4 1,184.1 1,421.3 1,637.0 1,934.1 2,076.8 2,161.2 2,107.4 921.1 Overseas 745.8 880.5 1,271.6 1,749.5 2,249.3 3,138.5 2,717.8 3,114.5 2,688.0 607.7 Total 7,402.2 8,389.9 9,671.6 10,556.1 11,547.8 13,359.5 14,135.1 14,669.6 14,845.5 9,971.4 Data Source: “Yuka-Shoken-Houkokusyo” (Statutory disclosure required by Japan’s Security Exchange Law; Japanese version only) and “Kessan Tanshin” (Financial Results for each Fiscal Year)
(*)Net Transfer of General Reserve is included in Total Cumulative Credit Costs, but is not included in Cumulative Credit Costs for each industry. / Cumulative Credit Costs for 93/3~02/9。
Total of 5 Industries above (Domestic)
(*)Cumulative Credit Costs Credit Costs Ratio
Total of 5 Industries above (Domestic)
Increased during 1985-93
Data Source: “Yuka-Shoken-Houkokusyo” (Statutory disclosure required by Japan’s Security Exchange Law; Japanese version only) , “Kessan Tanshin” (Financial Results for each Fiscal Year) and research papers of securities firms 10
Construction 5% Real Estate 29% Finance and Insurance 48% Wholesale, Retail and Restaurant 3% Services 15% Construction 2% Real Estate 15% Finance and Insurance 43% Services 31% Wholesale, Retail and Restaurant 9%
Share of Loan Amount by Industry Share of Credit Costs by Industry
Disclosed cumulative credit costs include not only those for domestic loans but also those for overseas loans.
Notice !
Domestic + Overseas
Domestic
Domestic + Overseas Domestic + Overseas
Data Source: “Yuka-Shoken-Houkokusyo” (Statutory disclosure required by Japan’s Security Exchange Law; Japanese version only) , “Kessan Tanshin” (Financial Results for each Fiscal Year) and research papers of securities firms 13
6% 8% 10% 12% 14% 16% 18% 20% 22% 25% 30% 35% 40% 45% 50% Sumitomo Trust A Group B Bank C Bank D Group E Group F Group G Group H Regional Bank I Regional Bank