
SLIDE 1
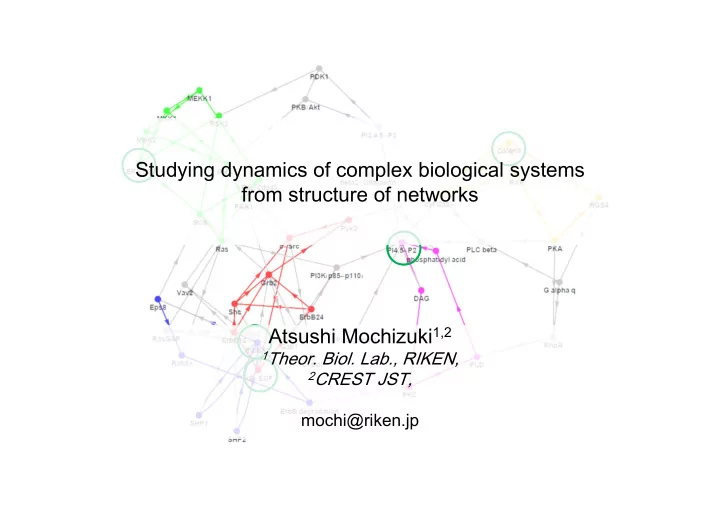
Studying dynamics of complex biological systems from structure of networks Atsushi Mochizuki1,2
- 1Theor. Biol. Lab., RIKEN,
2CREST JST,
mochi@riken.jp
Studying dynamics of complex biological systems from structure of - - PowerPoint PPT Presentation
Studying dynamics of complex biological systems from structure of networks Atsushi Mochizuki 1,2 1 Theor. Biol. Lab., RIKEN, 2 CREST JST, mochi@riken.jp Research activity of Theoretical Biology Laboratory Somite segmentation Protein interaction
2CREST JST,
mochi@riken.jp
KaiC KaiA KaiB P KaiC KaiA P KaiC KaiA KaiB P KaiC promote bind bind dissociation P KaiC unknown
Gene regulatory network 細胞分化の多様性 Protein interaction Plant leaf formation Retinal cone mosaic
Somite segmentation Cell migration Cytomembrane
Structural theories
・Linkage logic ・Structural sensitivity
A: Gene regulatory network
Sato group, Sato lab.
j j t
x t x t
j J
for all implies
t
t t
x x
B: Signal transduction
Hiroshima group, Sako lab.
C: Carbon metabolism
Shirane group, Nakayama-lab.
j j m mw w x x S
CREST Program, JST “Bio-Dynamics”
Regulatory networks Network -> Key molecules
Chemical reaction networks Network -> Response of system
Regulatory networks Network -> Key molecules
Chemical reaction networks Network -> Response of system
・Network analysis ・Measuring ・Perturbation Network information Prediction without assuming details
A B C D E F G H J I
KO
A B C D E F G H J I
KO
connecting network topology and system behavior.
Mochizuki A. & Fiedler B. (2015) J. Theor. Biol. 367, 189-202. Okada T. & Mochizuki A. Phys. Rev. Lett. (In Press)
Mochizuki, A., Fiedler, B. et al. J. Theor. Biol. (2013) 335, 130-146 Imai, K., et al. Science (2006) 312, 1183-1187.
brain notochord epidermis muscle mesenchyme endoderm nerve cord initial conditions cell‐cell interactions Imai, K., et al. Science (2006) 312, 1183‐1187.
Hoya a sea squirt an ascidian
a chordate animal
16-cell stage 64-cell stage gastrula egg tailbud stage
A A A C A A B B A B B C C A B C C
B C A Regulatory network Dynamics of concentration (or gene activity)
time gene expression gene expression time
state 1 state 2
brain notochord epidermis muscle mesenchyme endoderm nerve cord initial conditions cell‐cell interactions
Imai, K., et al. Science (2006) 312, 1183‐1187.
Linkage: Information of argument set
use argument set only. do not consider detailed formula of fk, dk.
i j k
, : Input set of k correspond to edge of network iff gene k activates itself. Decay condition
(including self repression) ,
j j t
x t x t
Collaboration with Bernold Fiedler (Berlin Free Univ.) I V \ V I is feedback vertex set is cycle free if, and only if, j J V
for all
implies
t
t t
x x
A feedback vertex set ⟺ a set of determining nodes for any functions.
A set of vertices whose removal leaves a graph without cycles
in Graph theory
in Dynamical theory
Observing long-term dynamics on determining nodes ⇒ Observing attractors of total system. Fiedler, B., Mochizuki, A. et al. J. Dyn. Differ. Eqns. (2013) 25, 563-604. Mochizuki, A., Fiedler, B. et al. J. Theor. Biol. (2013) 335, 130-146
1 node 1 node 1 node 2 nodes 2 nodes 1 node 1 node The theory gives an assurance that:
3 nodes
dynamics of downward is determined uniquely.
dynamics of whole network.
⇒ Feedback Vertex Set!
j j t
x t x t
j J V
for all
implies
t
t t
x x
Observing long-term dynamics
⇒ Observing attractors of total system.
Controlling Feedback Vertex Set to converge to one of attractors ⇒ Control of total system.
2 stable oscillation (P1、P2) 1 unstable oscillation (UP) 1 unstable stationary point (USS)
Mirsky et al., 2009
FVS <= prescribe Others <= ODE
P1 -> P2
(1) Prepare time track of FVS on the solution, P1, P2, UP, USS. (2-1) Prescribe FVS, to follow the value on the solution. (2-2) The remaining variables, nonFVS, are calculated by remaining ODEs.
FVS <= prescribe Others <= ODE
UP, USS; unstable in original system with 21 variable, but stable in reduced system with 14 variables.
FVS - CLK <= prescribe CLK <= ODE Others <= ODE
Uniqueness Feedback vertex set (determined from networks) (1) specify minimal sufficient set of variables to detect all of the possible dynamical behaviors. (2) specify minimal sufficient set of variables to control whole system.
Fiedler, B., Mochizuki, A. et al. J. Dyn. Differ. Eqns. (2013) 25, 563-604. Mochizuki, A., Fiedler, B. et al. J. Theor. Biol. (2013) 335, 130-146
Liu et al. Nature (2011)
Linear Steering Observing nodes Controlling nodes Including effect of input signals For details, See Mochizuki, A., Fiedler, B. et al. J. Theor. Biol. (2013) 335, 130-146
,
Switching between attractors
Observing nodes = Controlling nodes
(Observed data can be directly used for control)
Diversity generated from internal dynamics only
brain notochord epidermis muscle mesenchyme endoderm nerve cord initial conditions cell‐cell interactions Imai, K., et al. Science (2006) 312, 1183‐1187.
1 feedback vertex
nodal FoxD-a/b Otx Twist-like-1 ZicL FGF9/15/20 NoTrlc
If gene expressions are binary (on/off), the system can generate only two states. It is impossible to generate 7 different binary steady states (cell differentiations). Remove genes regulating no gene (down most) genes not regulated by any genes (upper most) “Binary” is incorrect, or Network is not enough.
brain notochord epidermis muscle mesenchyme endoderm nerve cord initial conditions cell‐cell interactions Version 2015
A cell B cell
Thm: Whole system can be controlled by controlling FVS genes only. ・Verify whether cell fate can be controlled by changing expression of the five genes. 4 genes from each cell 1 gene from one of neighboring cells
Zic Foxd Twist-like1 Foxa Nodal Snail Neurogenin Delta-like dpERK1/2
5 species of genes
Theory Feedback vertex set (determined from networks) (1) specify minimal sufficient set of variables to detect all of the possible dynamical behaviors. (2) specify minimal sufficient set of variables to control whole system.
Fiedler, B., Mochizuki, A. et al. J. Dyn. Differ. Eqns. (2013) 25, 563-604. Mochizuki, A., Fiedler, B. et al. J. Theor. Biol. (2013) 335, 130-146
Experiment Gene network for Cell-fate determination (1) Verify controllability by FVS genes (2) Obtain regulatory mechanism for exclusive cell-fate