
SLIDE 1
Structural Vulnerability Map
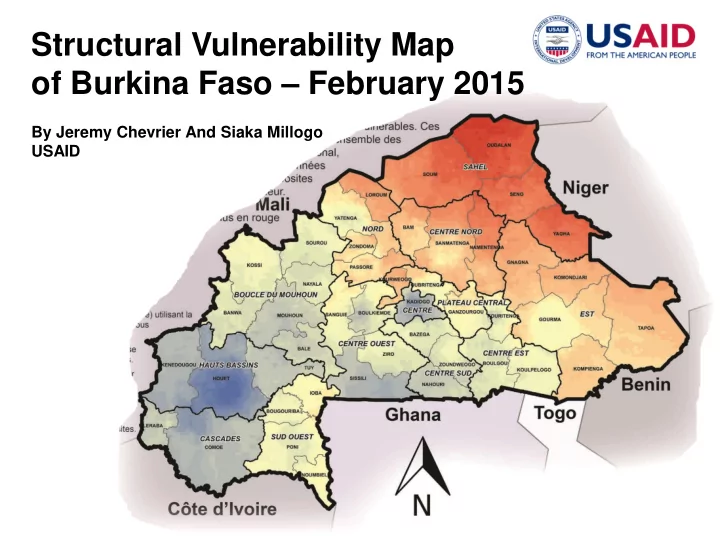
- f Burkina Faso – February 2015
By Jeremy Chevrier And Siaka Millogo USAID
Structural Vulnerability Map of Burkina Faso February 2015 By - - PowerPoint PPT Presentation
Structural Vulnerability Map of Burkina Faso February 2015 By Jeremy Chevrier And Siaka Millogo USAID The Purpose of the Map To leverage evidence and data analytics to better geographically target zones in need of long term resilience
By Jeremy Chevrier And Siaka Millogo USAID
The map ISN’T:
(conjunctural)
The map IS:
investments (most vulnerable zones)
pixel in map has a vulnerability/resilience score)
Step 6 – Weighted Averaging Average datasets using weighting based on consensual subject matter expert judgment to create composites.
1. Related dataset should be grouped for aggregation into representative composites (ie. direct poverty measurements and proxies to poverty grouped into a poverty composite) 2. Relative weighting of each dataset contributing to the representative composite should be discussed in a consensual manner with the relevant subject matter experts 3. Sometimes composites created will aggregate again into higher level composites and weighting must be decided for these aggregations also
* Important to note here that refusing to weight datasets when averaging them into composites creates implicit weighting where all data becomes equally weighted, which is a kind of unintentional weighting by default. This doesn’t reflect the reality of the variable contributions different datasets have in relation to vulnerability.
Table continues on next slide…
resilience investments. Government of Burkina should take the lead.
understand the dynamics and relative contributions of the different factors in relation to vulnerability in the different geographies
vulnerability of a zone, appropriate interventions can be
Three of the most vulnerable communes can be compared to three
vulnerability and glean insights.
averaging historical datasets, change in tendency will likely take at least five years. Thus the map can be considered valid for five years. Every five years, all new data over last five years can be aggregated to create an updated map of structural vulnerability to see if the tendencies are changing.
explored (ie. HEA, SAP, FEWSNET, Cadre harmonisé)
vulnerability and conflict/stability issues.