
SLIDE 1
1
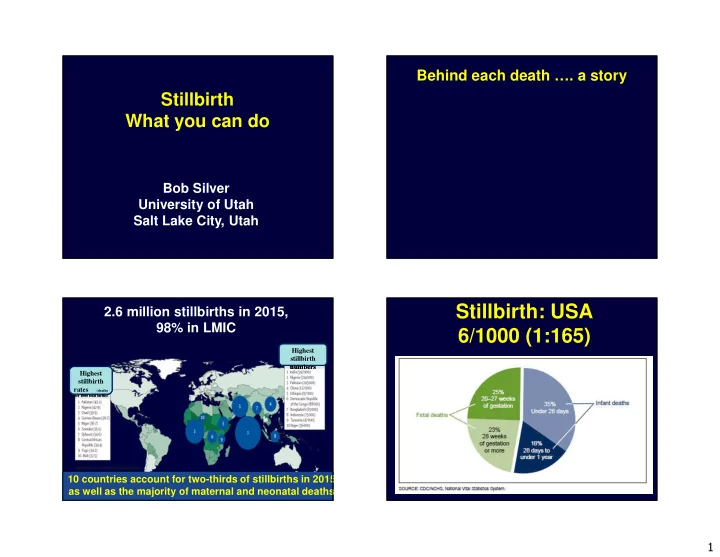
Stillbirth What you can do
Bob Silver University of Utah Salt Lake City, Utah
Behind each death …. a story
2.6 million stillbirths in 2015, 98% in LMIC
Source: Blencowe et al 2016
10 countries account for two-thirds of stillbirths in 2015 as well as the majority of maternal and neonatal deaths
Highest stillbirth rates (deaths
per 1000 total births)
Highest stillbirth rates (deaths
per 1000 total births)
Highest stillbirth numbers Highest stillbirth numbers