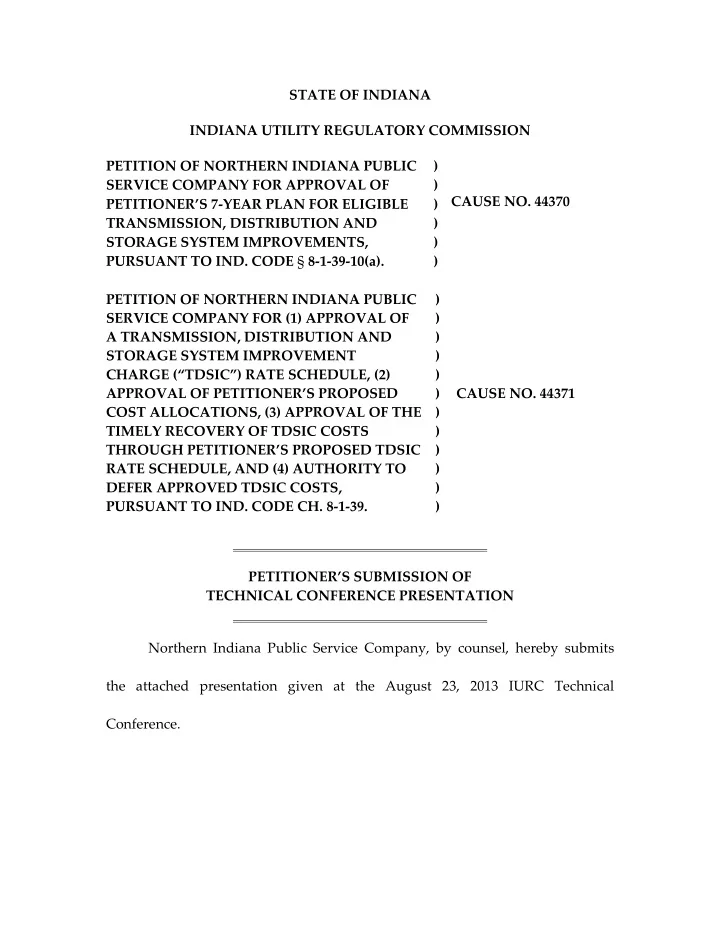
STATE OF INDIANA INDIANA UTILITY REGULATORY COMMISSION PETITION OF NORTHERN INDIANA PUBLIC SERVICE COMPANY FOR APPROVAL OF PETITIONER’S 7-YEAR PLAN FOR ELIGIBLE TRANSMISSION, DISTRIBUTION AND STORAGE SYSTEM IMPROVEMENTS, PURSUANT TO IND. CODE § 8-1-39-10(a). ) ) ) ) ) ) CAUSE NO. 44370 PETITION OF NORTHERN INDIANA PUBLIC SERVICE COMPANY FOR (1) APPROVAL OF A TRANSMISSION, DISTRIBUTION AND STORAGE SYSTEM IMPROVEMENT CHARGE (“TDSIC”) RATE SCHEDULE, (2) APPROVAL OF PETITIONER’S PROPOSED COST ALLOCATIONS, (3) APPROVAL OF THE TIMELY RECOVERY OF TDSIC COSTS THROUGH PETITIONER’S PROPOSED TDSIC RATE SCHEDULE, AND (4) AUTHORITY TO DEFER APPROVED TDSIC COSTS, PURSUANT TO IND. CODE CH. 8-1-39. ) ) ) ) ) ) ) ) ) ) ) ) CAUSE NO. 44371 PETITIONER’S SUBMISSION OF TECHNICAL CONFERENCE PRESENTATION Northern Indiana Public Service Company, by counsel, hereby submits the attached presentation given at the August 23, 2013 IURC Technical Conference.
STATE OF INDIANA INDIANA UTILITY REGULATORY COMMISSION PETITION OF - - PDF document
STATE OF INDIANA INDIANA UTILITY REGULATORY COMMISSION PETITION OF NORTHERN INDIANA PUBLIC ) SERVICE COMPANY FOR APPROVAL OF ) CAUSE NO. 44370 PETITIONERS 7-YEAR PLAN FOR ELIGIBLE ) TRANSMISSION, DISTRIBUTION AND ) STORAGE SYSTEM
Electric TDSIC
August 23, 2013 IURC Technical Conference Cause No. 44370 & Cause No. 44371
Agenda
- Roadmap of Testimony
- Seven Year Plan (44370)
– Annual Program Spends
- Project Categories
– Year 1 Project Detail – Need for Flexibility – Black & Veatch Presentation
- Tracker/Deferral Mechanism Shell (44371)
– Revenue Requirement Calculations – Proposed Capital Structure and Cost Allocation – Projected Rate Impacts
- Overall Timeline
2
Roadmap of testimony
- Seven Year Plan (44370)
– Frank A. Shambo
- Overall request for approval
- Statutory authority
- Definitions of key terms
- Treatment of economic development projects
- Updating the Seven Year Plan via the Tracker/Deferral petition
- NIPSCO’s capital allocation process including direct, indirect and AFUDC dollars
- Economic impact of the Seven Year Plan (B&V Economic Study)
- Impact to retail revenue of the Seven Year Plan
- NIPSCO’s stakeholder process
– Timothy A. Dehring
- Development of the Seven Year Plan
- Detail of the Seven Year Plan (structure, projects and categories, timing, dollars)
- Black & Veatch Long-Term Capital Plan
- NIPSCO’s detailed cost estimates
- Black & Veatch Independent Cost Review
3
Roadmap of testimony (cont.)
- Tracker/Deferral Mechanism Shell (44371)
– Frank A. Shambo
- Relief requested
- Statutory authority
- Timely recovery under the TDSIC schedule
- Timing of deferrals
- Cost allocation methodology
- Calculation of allowed return
- Projected average aggregate increase of NIPSCO’s TDSIC
– Derric J. Isensee
- Calculation of tracker and deferral revenues and accounting treatment
- Timeline of NIPSCO’s future tracker filings
- Interaction with FAC earnings and expense tests
- Impact on customer rates and charges
- Proposed changes and additions to NIPSCO’s electric service tariff
4
Required findings for the seven year plan
- Determination that the seven year plan is reasonable
- Finding of the best estimate of the cost of the eligible
improvements
- Determination that the public convenience and necessity require
- r will require the eligible improvements
- Determination that the estimated costs of the eligible improvements
are justified by incremental benefits attributable to the plan
5
Proposed definitions for the seven year plan
- Safety
– Investments made in facilities that protect life and/or property
- Reliability
– Investments made in facilities that preserve the ability to serve peak load, maintain system performance, or respond to unplanned events
- System Modernization
– Investments in facilities that will cost effectively upgrade the system that will maintain system stability and/or reliability over a long period of time
- Economic Development
– Investments in incremental facilities undertaken to attract new jobs in NIPSCO’s service territory
- Transmission and Distribution
– Equipment that is classified as transmission and distribution from the FERC Uniform System
- f Accounts
- Under Construction
– The date the utility incurs charges that are assignable to a project’s work order through the date the project is placed in service and all charges that are assignable to the project’s work
- rder have been incurred
6
NIPSCO electric TDSIC long term plan overview
Long Term Plan Strategy
Long Term Plan
T&D System Deliverability Aging Infrastructure
- New Lines & Substations
- Upgrades to Existing Lines &
Substations
- Replace Prone to Failure Cable
- System Protection Modernization
- Risk Based Replacement of Aging
Assets (POF x COF)
Long term plan refreshed annually with new asset condition and system information
7
NIPSCO’s decision model for TDSIC investments
- T&D System Deliverability Investments
– Deliverability tested during periods of high system stress – Target preservation of contingencies
- Transmission – Consistent with NERC reliability requirements
- Distribution – ability to serve customers with loss of 1st system element
– Outputs
- New lines and substations
- Capacity upgrades to existing lines and substations
- Aging Infrastructure Investments
– Assess risk of T&D system elements
- Risk score = Probability of Failure for each asset x Consequence of Failure for each
asset – Rank replacement based on risk score for each asset – Additionally, target prone to failure system elements (UG Cable, System Protection)
- Annual Refresh of Both Segments
8
Seven year plan – annual program spends
9 NORTHERN INDIANA PUBLIC SERVICE COMPANY 7-YEAR ELECTRIC PLAN BY PROJECT CATEGORY (A) (B) (C) (D) (E) (F) (G) (H) (I) (J) Line No. Project Category 2014 2015 2016 2017 2018 2019 2020 7-Year Total % of Total Direct Capital Transmission Project Category 1 Transmission Substations $19,287,771 $6,940,922 $30,656,338 $21,268,715 $30,613,541 $42,658,936 $65,241,980 $216,668,203 2 Transmission Lines $3,479,414 $3,941,591 $12,517,710 $2,384,768 $21,736,967 $23,406,269 $22,829,854 $90,296,573 3 Transmission Project Category Total $22,767,185 $10,882,513 $43,174,048 $23,653,483 $52,350,508 $66,065,205 $88,071,834 $306,964,776 Distribution Project Category 4 4kV Lines $1,620,000 $720,000 $2,160,000 $1,238,000 $3,155,000 $3,260,000 $3,025,000 $15,178,000 5 4kV Substations $0 $600,000 $100,000 $1,100,000 $125,000 $50,000 $0 $1,975,000 6 Underground Cable $5,000,000 $5,000,000 $22,000,000 $22,000,000 $22,000,000 $22,000,000 $22,000,000 $120,000,000 7 Distribution Substations $13,231,915 $20,072,029 $26,480,979 $18,991,985 $35,205,891 $42,178,591 $30,051,461 $186,212,851 8 Distribution Lines $9,380,900 $8,425,458 $35,484,973 $22,716,532 $35,163,601 $63,546,204 $53,651,705 $228,369,373 9 Distribution Project Category Total $29,232,815 $34,817,487 $86,225,952 $66,046,517 $95,649,492 $131,034,795 $108,728,166 $551,735,224 10 Economic Development $10,000,000 $10,000,000 $10,000,000 $10,000,000 $10,000,000 $10,000,000 $10,000,000 $70,000,000 11 Total Direct Capital $62,000,000 $55,700,000 $139,400,000 $99,700,000 $158,000,000 $207,100,000 $206,800,000 $928,700,000 12 Indirect Capital $11,616,009 $8,740,946 $14,472,263 $11,145,949 $17,866,112 $23,410,055 $23,531,169 $110,782,503 13 AFUDC $1,622,394 $2,114,909 $5,049,985 $3,637,890 $5,771,808 $7,565,186 $7,559,315 $33,321,487 14 Total Capital $75,238,403 $66,555,855 $158,922,247 $114,483,839 $181,637,920 $238,075,241 $237,890,484 $1,072,803,990 15 Amount of Transmission $26,895,935 $23,792,131 $56,810,914 $40,925,243 $64,931,226 $85,106,222 $85,040,176 $383,501,848 35.7% 16 Amount of Distribution $48,342,468 $42,763,724 $102,111,333 $73,558,596 $116,706,694 $152,969,019 $152,850,308 $689,302,142 64.3% 17 Total Capital $75,238,403 $66,555,855 $158,922,247 $114,483,839 $181,637,920 $238,075,241 $237,890,484 $1,072,803,990 100.0%
Project categories
- NIPSCO’s 7-Year Electric Plan represents work that NIPSCO must
perform in order to maintain safe, reliable service
– T&D substations and lines, 4kV replacement, underground cable
- Economic development (“ED”) was also included as a component of
the plan to meet the legislative intent of Ind. Code § 8-1-39
– ED category is a projection and may be redeployed within the 7-Year Electric Plan as circumstances warrant (lack of ED opportunities, ongoing System Deliverability testing, emergent conditions, etc.)
10
Seven year plan – Year 1 project detail
11
(A) (B) (C) (D) (E)
Line No.
Project Category Project Driver Project Title Project Cost (direct dollars) Project Category (direct dollars) Transmission System Investments
Transmission Substations 1 Arresters Aging Infrastructure Arrester Replacements $150,000 $150,000 2 Batteries Aging Infrastructure Replace Battery and Charger Equipment $247,200 $247,200 3 345kV or 138kV Breaker Upgrades Aging Infrastructure
- St. John 34519 BKR
$790,000 4 345kV or 138kV Breaker Upgrades Aging Infrastructure Lake George 138KV Equipment Upgrade $1,225,000 5 345kV or 138kV Breaker Upgrades Aging Infrastructure Maple 138KV Terminal Equipment Upgrades $1,300,000 $3,315,000 6 Disconnects Aging Infrastructure Substation Switch Replacements $284,000 $284,000 7 69kV Relay Upgrades Aging Infrastructure Flint Lake - 69KV Protection Upgrades $1,200,000 $1,200,000 8 345kV or 138kV Relay Upgrades Aging Infrastructure Circuit 34508 Relay Upgrade $445,397 9 345kV or 138kV Relay Upgrades Aging Infrastructure Circuit 34524 Relay Upgrade $412,725 10 345kV or 138kV Relay Upgrades Aging Infrastructure 138KV Breaker Control Replacement $50,000 11 345kV or 138kV Relay Upgrades Aging Infrastructure Circuit 13877 Relay Upgrade $275,000 12 345kV or 138kV Relay Upgrades Aging Infrastructure Circuit 13869 Relay Upgrade $259,000 13 345kV or 138kV Relay Upgrades Aging Infrastructure Circuit 13866 Relay Upgrade $367,539 14 345kV or 138kV Relay Upgrades Aging Infrastructure Circuit 13854 Relay Upgrade $440,000 15 345kV or 138kV Relay Upgrades Aging Infrastructure Circuit 13812 Relay Upgrade $367,539 16 345kV or 138kV Relay Upgrades Aging Infrastructure Circuit 13827 Relay Upgrade $445,000 17 345kV or 138kV Relay Upgrades Aging Infrastructure Install Fiber Optic Static from Starke to RMSGS and Luchtman to MCGS (supports 2015 relay upgrades) $1,488,456 18 345kV or 138kV Relay Upgrades Aging Infrastructure Digital Fault Recorder Upgrade Program $250,000 19 345kV or 138kV Relay Upgrades Aging Infrastructure Substation Annunciator Replacement Program $120,000 $4,920,656 20 Potential Transformers Aging Infrastructure Potential Transformer Replacements $200,000 $200,000 21 New/Rebuild Substation System Deliverability South Valpo Substation $8,500,000 $8,500,000 22 Substation Engineering Aging Infrastructure Engineering $470,915 $470,915 23 Transmission Substations Total $19,287,771 $19,287,771 Transmission Lines 24 69kV Line Switch Replacement Aging Infrastructure 69kV Line Switch Replacements $56,000 $56,000 25 69kV New/Rebuild Line Aging Infrastructure Finish Reconductoring 69kV Ckt 6964 $452,500 $452,500 26 138kV New/Rebuild Line System Deliverability South Valpo Substation New Transmission Lines $2,500,000 $2,500,000 27 Line Engineering Aging Infrastructure Engineering $470,914 $470,914 27 Transmission Lines Total $3,479,414 $3,479,414 28
Total Transmission Investment $22,767,185 $22,767,185
Seven year plan – Year 1 project detail (cont.)
12
(A) (B) (C) (D) (E)
Line No.
Project Category Project Driver Project Title Project Cost (direct dollars) Project Category (direct dollars) Distribution System Investments
29 Underground Cable Replacement Program Aging Infrastructure Underground Cable Replacement Program $5,000,000 $5,000,000 4kV Replacement Program 30 4kV Lines Aging Infrastructure Gary, 4KV Conversion - Upgrade Cir 2143 - Fairbanks to Colfax - 4KV to 12.5 KV $930,000 31 4kV Lines Aging Infrastructure Gary, 4KV Conversion - Upgrade Cir 2641 - Fairbanks to Gibson - 4KV to 12.5 KV $690,000 32 4kV Replacement Program Total $1,620,000 $1,620,000 Distribution Substations 33 Arrestors Aging Infrastructure Arrestor Replacement $96,000 $96,000 34 Breaker/Recloser Upgrades Aging Infrastructure Recloser Replacement Program $4,930,000 35 Breaker/Recloser Upgrades System Deliverability Wheeler Sub - Add Motor Operator to 12kV Regulated Bus Tie Switch $50,000 $4,980,000 36 Batteries Aging Infrastructure Replace Battery and Charger Equipment $196,000 $196,000 37 Feeder Cable Aging Infrastructure Feeder Cable Replacement $360,000 $360,000 38 Line Switches Aging Infrastructure Switches to Clear Incoming Lines Program $390,000 $390,000 39 Switchgears Aging Infrastructure Cedar Lake Sub, Replace Switchgear (2 of 2) $1,000,000 $1,000,000 40 12kV or 34kV Transformers Aging Infrastructure Ohio St Replace #1 & #2 Three Phase Regulators $300,000 41 12kV or 34kV Transformers Aging Infrastructure LTC Voltage Control $100,000 42 12kV or 34kV Transformers System Deliverability Cedar Lake Sub, Upgrade Transformer to 28 MVA (1 of 2) $1,500,000 43 12kV or 34kV Transformers System Deliverability Liberty Park add Fans #7 and #8 trsf's to get to 28 MVA $187,000 $2,087,000 44 Potential Transformers Aging Infrastructure Potential Transformer Replacement $72,000 $72,000 45 Failed Transformers Aging Infrastructure Failed Transformers $880,000 $880,000 46 New/Rebuild Substations System Deliverability Merrillville, New 69 -12kV Substation $2,600,000 47 New/Rebuild Substations System Deliverability Portage, New 69-12 Kv Sub - Land $100,000 $2,700,000 48 Substation Engineering Aging Infrastructure Engineering $470,915 $470,915 49 Distribution Substations Total $13,231,915 $13,231,915 Distribution Lines 50 Circuit Performance Improvement Program Aging Infrastructure Circuit Performance Improvement Program $1,000,000 $1,000,000 51 Wood Poles Aging Infrastructure Wood Poles $4,909,986 $4,909,986 52 AB Chance Cutout and Aluminum Bells Aging Infrastructure AB Chance Cutout and Aluminum Bells $3,000,000 $3,000,000 53 Line Engineering Aging Infrastructure Engineering $470,914 $470,914 54 Distribution Lines Total $9,380,900 $9,380,900 55
Total Distribution Investment $29,232,815 $29,232,815
56
Total T&D Investment $52,000,000 $52,000,000
Need for flexibility in NIPSCO’s seven year plan
- Electric system is dynamic and plan should be adjusted to reflect
future characteristics
- New information will continue to come to light as the work is
performed and the system changes
- The consequence of failure driver will change for equipment on the
system as work is performed requiring the plan to be refreshed
- Inevitably assets will fail outside of expectations (emergent
condition) requiring the plan to be refreshed
- Additional factors like capital availability/cost, storm events, and
additional environmental regulations can also change the investment timing
13
BLACK & VEATCH PRESENTATION
14
PREPARED FOR:
NORTHERN INDIANA PUBLIC SERVICE COMPANY AUGUST 23, 2013 TECHNICAL CONFERENCE
OVERVIEW OF NIPSCO 7-YR T&D CAPITAL PLAN
23 August 2013
OUTLINE OF PRESENTATION
23 August 2013
Agenda Item Presenter Asset management overview Will Williams B&V Report Overview Mike Elenbaas NIPSCO T&D risk model review Doland Cheung NIPSCO 7-yr plan results review Mike Elenbaas
2
- Review the Black & Veatch Report Results and
Approach
- Build Common Understanding of Approach, Results
OBJECTIVES OF THIS MEETING
23 August 2013
3
- Founded in 1915
- Global workforce of more than 10,000
- Employee-owned corporation
- $3.3 billion in annual revenues in 2012
- More than 110 offices worldwide
- Completed projects in more than
100 countries
BLACK & VEATCH CORPORATION OVERVIEW
4
Black & Veatch conducts 7,000+ active projects globally at any one time
23 August 2013
ASSET MANAGEMENT OVERVIEW
NIPSCO’S PLAN ALIGNS WITH GOOD PRACTICE ASSET MANAGEMENT
5
Asset Management enables Utilities to Optimize Expenditure
- Aging, critical infrastructure
- Very public failures
- Limited money and staff – must
- ptimize
- How to balance and optimize risk,
criticality, and investment (maintain, replace, new)?
- Connecting the dots—silos of data and
processes need to be connected for decision making
- Increasingly clients are turning to Asset
Management to meet the challenges
MARKET ISSUES DRIVING ASSET MANAGEMENT
6
23 August 2013
- PAS 55 – Developed in the United Kingdom for
utilities as standard for good practice asset management of asset-intensive industries
- PAS = Publicly Available Standard
- ISO 55000 in development
ASSET MANAGEMENT – INTERNATIONAL STANDARDS OVERVIEW
23 August 2013
7
OVERVIEW OF LONG TERM PLAN REPORT
8
OVERVIEW OF LONG TERM PLAN REPORT
9
- Confidential Risk
Model Results
- Full Economic
Impact Assessment Results Report
Appendices 7YP Sections
Overview & Objectives Risk Mgt Model T&D Assets for Replacement Asset Class Overview T&D Asset Replacement Program Section 6 Section 5 Section 4 Section 3 Section 2 Section
23 August 2013
Exec Summ Section 1
SECTION 2 OF REPORT:
OBJECTIVES AND APPROACH
10
OBJECTIVES FOR LONG TERM PLAN
11
DRAFT WORKPRODUCT – FOR INTERNAL DISCUSSION ONLY
23 August 2013
Reliability: Maintain/Enhance Performance Reliability: Maintain/Enhance Performance
- High Reliability Performance
Aging System: Proactive Replacement Program Aging System: Proactive Replacement Program
- Proactive Replacement of aging equipment across system
Safety First Safety First
- Proactive/Planned Program Required For
Safety of NIPSCO workers and customers
Economic Development Economic Development
- Direct and Indirect FTE and Investment Impact
Objectives Requirement Benefit
- Risk-based plan that allocates capital across system:
- Focus capital spend on high-risk assets and aging assets at or
near the end of their useful life
- Proactive plan to address aging system before higher rate
- f asset failures impacts reliability performance
FOCUS OF NIPSCO’S 7-YR PLAN
23 August 2013
12
Risk: Almost 35% of breakers are at or beyond typical life.
- Assets across NIPSCO’s T&D system
are aging and in need of replacement
- NIPSCO experienced significant
growth and system expansion 30 to 40 years ago and many of these assets are nearing end of useful life
PARTS OF NIPSCO’S T&D SYSTEM ARE AGING
23 August 2013
13
10 20 30 40 50 60 No Data 2 4 6 8 10 12 14 16 18 20 22 24 26 28 30 32 34 36 38 40 42 44 46 48 50 52 54 56 58 60 62 64 66 68 70 72 Number of Transformers Age (Years)
Power Transformers -All Voltage Levels
Aging Assets, Proactive Replacements Needed to Avoid Failures and Future Rate Spikes
0.0% 1.0% 2.0% 3.0% 4.0% 5.0% 6.0% 7.0% 2006 2007 2008 2009 2010 2011 2012 Percentage Year
% of Rejected Poles
- Emergency work creates
higher potential for unsafe working conditions
- Recent aging 4kV circuit
breaker failed
- No safety issues with
NIPSCO workers in this instance, however proactive, planned projects enable a safe work environment
ENABLE SAFETY THROUGH PROACTIVE PLANNING
23 August 2013
14
- Approach
- Proven IMPLAN
model (Impact Analysis for PLANning) for assessment
- Forecast of
investment, with granularity on costs, sources, etc.
ECONOMIC IMPACT ASSESSMENT APPROACH
15
Economic Impact Assessment (Jobs, Direct/Indirect $)
Cost by Type (Labor, Material, etc.) Cost by Type (Labor, Material, etc.) Investment by Asset/Project Investment by Asset/Project Cost Breakdown by Location (Indiana, U.S., Intl) Cost Breakdown by Location (Indiana, U.S., Intl)
23 August 2013
$966 $351 $998 $2,315 $0 $500 $1,000 $1,500 $2,000 $2,500 Direct Indirect Induced Total $million IN $$ Other US $$ Total US $$ 8,714 6,005 14,719 2,000 4,000 6,000 8,000 10,000 12,000 14,000 16,000 Indiana Rest of U.S. Total U.S. Job-years
ENABLE ECONOMIC DEVELOPMENT
23 August 2013
16
- Estimated 8,714 jobs created or
supported in Indiana in 7 yrs
- Additional over 6,000 jobs in the rest
- f the U.S.
- Total U.S. impact of over 14,500 jobs
- Total IN output of $1.1 B
- $620M IN direct output
- $32M IN indirect output
- $439M IN induced output
Job Creation Economic Impact
LONG TERM T&D PLAN FOCUSED ON REDUCING SYSTEM RISK
23 August 2013
17
$25 $28 $76 $52 $110 $157 $157 42,153 54,393 37,139
34,000 36,000 38,000 40,000 42,000 44,000 46,000 48,000 50,000 52,000 54,000 56,000 20 40 60 80 100 120 140 160 180 2013 2014 2015 2016 2017 2018 2019 2020
Portfolio Total Risk Score Annual Capital Spend (Nominal $Millions)
Emergent Work Allocation Direct Budget Allocation "Run to Failure" Risk Profile Proposed 7 Year Plan Budget Risk Profile 32% Reduction in Total Risk Score after 7 Years
SECTIONS 3 & 4 OF REPORT:
T&D RISK MODEL
18
- Risk Modeling Approach
Defined
- Criticality / Consequence of
Failure
- Probability of Failure
- Based on asset age profile and
survivor curves from B&V survey
- Other Constraints for NIPSCO
(not in risk model)
- Operational Constraints
- Location of Assets
- Optimizing Operational Resources
NIPSCO RISK MODEL QUANTIFIES AND TARGETS HIGH RISK ASSETS
23 August 2013
19
1 2 3 4 5 1 2 3 4 5
Consequence of Failure Probability of Failure _
Risk = CoF x PoF
The model and results are a guide for T&D capital allocation, not all encompassing
RISK FACTORS: CONSEQUENCE OF FAILURE
23 August 2013
20
Consequence
- f
Failure Consequence
- f
Failure Customers Served Customers Served Loss of Generation Loss of Generation Safety/ Environmental Safety/ Environmental Customer Type Customer Type Reliability Reliability
Slightly Different Scoring Scales / Definitions For Transmission, Sub- transmission, Distribution
- Survivor curves widely used in
utility industry for depreciation analysis and asset management studies.
- Iowa S-curves selected for
different T&D asset classes based on combination of:
- B&V survey of depreciation life
by asset type for 15 electric utilities
- Iowa S-curve type selected
using latest NIPSCO depreciation study
SURVIVOR CURVES FOR AGE / RISK ANALYSIS
23 August 2013
21
0% 20% 40% 60% 80% 100% 5 10 15 20 25 30 35 40 45 50 55 60 65 70 Percent Surviving Age (Years)
Survivor Curve for 3 Phase, 138kV Transformers
S-curves and asset age used for PoF estimates
- Risk Matrix Results In
Report
- Transmission
- Substation assets
- Circuits
- Distribution
- Substation assets
- Circuits
RISK MODEL FOCUSES CAPITAL EXPENDITURES ON HIGH RISK ASSETS
23 August 2013
22
1 2 3 4 5 5 12 4 8 8 9 4 14 7 5 8 6 3 6 7 8 8 3 2 8 8 9 3 10 1 9 8 16 10 5 Count of Risk Scores
Count of Risk Scores
Probability of Failure Consequence of Failure
Highest Risk Assets
Note: Figures include sample cost amounts and risk scores, not actual NIPSCO results
SECTION 5 OF REPORT:
CAPITAL PROGRAM DESCRIPTIONS
23
ASSET REPLACEMENT SCHEDULE MODEL:
USED TO DEVELOP CAPITAL PROGRAMS
Asset Replacement Schedule Model
Survivor Curves Age Histograms
2,000 4,000 6,000 8,000 10,000 12,000 14,000 5 10 15 20 25 30 35 40 45 50 55 60 65 Number of Units Age (Years)2014 Poles, Wood
$0 $10,000 $20,000 $30,000 $40,000 $50,000 $60,000 2010 2011 2012 2013 2014 Project Costs Nominal ($000)Unconstrained Capital Forecast
23 August 2013
24
Capital Replacement Costs
FINANCIAL IMPACTS AND RISK MODEL USED TO TARGET HIGH-RISK ASSETS AND IDENTIFY MOST VALUABLE CAPITAL INVESTMENTS
Financial Impact Risk Model
1 2 3 4 5 5 4 3 20 4 2 1 3 54 121 37 4 1 2 398 223 166 25 8 1 PoF CoF
$0 $10,000 $20,000 $30,000 $40,000 $50,000 $60,000 2010 2011 2012 2013 2014 Project Costs Nominal ($000)Unconstrained Capital Forecast
Balance Tradeoffs
2010 2011 2012 2013 2014Optimized Capital Plan
50 100 150 200 250 300 2014 2015 2016 2017 2018 2019 2020 2021 2022 2023 Incremental Capex ($m) Base Flexible Scenario 1 Flexible Scenario 223 August 2013
25
- In order to demonstrate how the NIPSCO
replacement schedule model operates, the following two pages visually show how one of the capital plan cases impact the age histogram for the following asset class:
- 138kV transformers
- Other capital programs and their corresponding
assets are similarly modeled with the NIPSCO replacement schedule model
EXAMPLES OF CAPITAL PLAN CASES DEMONSTRATE REPLACEMENT SCHEDULE MODEL
23 August 2013
26
- Transformer 138 kV Age Histogram / S-curve
- No Replacements
EXAMPLE CAPITAL CASE DEVELOPMENT (P80)
23 August 2013
27
0% 10% 20% 30% 40% 50% 60% 70% 80% 90% 100% 1 2 3 4 5 6 7 8 9 10 3 6 9 12 15 18 21 24 27 30 33 36 39 42 45 48 51 54 57 60 63 66 69 72 75 78 81 84 87 90 93 96 99 Percent Surviving Number of Transformers Age (Years) P80 51 Years
- Transformer 138 kV Age Histogram / S-curve
- P80 Replacements
EXAMPLE CAPITAL CASE DEVELOPMENT (P80)
23 August 2013
28
0% 10% 20% 30% 40% 50% 60% 70% 80% 90% 100% 1 2 3 4 5 6 7 8 9 10 3 6 9 12 15 18 21 24 27 30 33 36 39 42 45 48 51 54 57 60 63 66 69 72 75 78 81 84 87 90 93 96 99 Percent Surviving Number of Transformers Age (Years) P80 51 Years
SECTION 6:
RISK MODEL RESULTS
29
7-YR PLAN RISK MODEL RESULTS
23 August 2013
30
Substation Capex Allocation of 60% Breakers, 40% Transformers
$25 $28 $76 $52 $110 $157 $157 42,153 54,393 37,139
34,000 36,000 38,000 40,000 42,000 44,000 46,000 48,000 50,000 52,000 54,000 56,000 20 40 60 80 100 120 140 160 180 2013 2014 2015 2016 2017 2018 2019 2020
Portfolio Total Risk Score Annual Capital Spend (Nominal $Millions)
Emergent Work Allocation Direct Budget Allocation "Run to Failure" Risk Profile Proposed 7 Year Plan Budget Risk Profile 32% Reduction in Total Risk Score after 7 Years
- Proposed 7-yr
Budget Allocates Substation Capital to Transformers and Circuit Breakers
BALANCE OF RISK AND AGE/CONDITION USED FOR CAPITAL ALLOCATION
23 August 2013
31
$602 $602 $602 46,055 36,566 34,873
5,000 10,000 15,000 20,000 25,000 30,000 35,000 40,000 45,000 50,000 $0 $200 $400 $600 $800 $1,000 Age-Based Allocation Balanced Allocation (60/40 CB/Xfmr) All Risk-Based Allocation
Total Portfolio Risk Score 7 yr Cumulative Capital Spend (Nominal $m)
Circuits BofSub CB Xfmr Total Portfolio Risk Score
DRAFT 7-YR CAPITAL SPENDING IN BLACK & VEATCH REPORT
23 August 2013
32
$6 $10 $10 $11 $11 $11 $12 $5 $5 $22 $22 $22 $22 $22 $9 $10 $11 $13 $15 $17 $19 $17 $3 $22 $5 $5 $6 $6 $6 $7 $26 $16 $38 $57 $56 $10 $11 $38 $24 $56 $84 $82
$53 $46 $129 $90 $148 $197 $197
$0 $50 $100 $150 $200 $250
Nominal $Millions
Circuits Substations Capacity & Reliability Emergent Work Underground Cable System Protection
COMPARISON OF DIFFERENT CAPITAL CASES FROM SECTION 6 OF REPORT
23 August 2013
33
$491 $604 $849 54,393 40,140 37,139 35,199
34,000 39,000 44,000 49,000 54,000 59,000 $0 $100 $200 $300 $400 $500 $600 $700 $800 $900 P90 Proposed 7 Year Plan P80
Total Portfolio Total Risk Score 7 Year Cumulative Capital Spend (Nominal $Millions)
7 Year Cumulative Spend "Run to Failure" Risk Profile 2020 Risk Score
- Black & Veatch Review Team
- Experienced Electric T&D project cost estimators and
professional engineers
- Developed estimates for 2014 projects, unit cost
estimates
- All cost estimates found reasonable for planning
purposes
- Discussed NIPSCO cost estimating process
- Process found to be reasonable, in line with industry
standards
INDEPENDENT COST REVIEW
23 August 2013
34
INDEPENDENT COST REVIEW
23 August 2013
35
All Reviewed Capital Cost Estimates Found Reasonable by B&V Cost Review Team
DISCUSSION / Q&A
23 August 2013
36
REVENUE REQUIREMENT CALCULATIONS
15
Capital structure
- NIPSCO will use a capital structure utilizing the current cost of long-
term debt and the cost of common equity approved in NIPSCO’s last electric rate case
- This approach is consistent with the TDSIC statute outlining the
factors in determining the pretax return
- This approach is also consistent with how NIPSCO will finance the
incremental capital spend of the 7-Year Electric Plan
- Under this approach, NIPSCO electric’s overall weighted cost of
capital is 8.59%
16
Cost allocation methodology
- Transmission investments will be allocated to all rates using the
adjusted revenue allocator approved in NIPSCO’s last retail base rate case order in Cause No. 43969
– Joint Exhibit C to the settlement agreement from Cause No. 43969 has been adjusted to remove interruptible Rider 675 revenues from Rates 632 and 634
- Distribution investments will be allocated among non-transmission
rates using the adjusted revenue allocator approved in NIPSCO’s last retail base rate case order
– Joint Exhibit C to the settlement agreement from Cause No. 43969 has been adjusted to remove revenue for transmission and sub-transmission-only rates 632, 633, and 634
17
Proposed cost allocation - transmission
18
Line No. (A) (B) (C) (D) (E) (F) Rate Code Base Rate Revenue Requirement (Cause No. 43969 - Exhibit C) % of Total Rider 675 Interruptible Revenue Adjustment Base Rate Revenue Requirement adjusted for Transmission Customers % of Total 1 611 377,800,682 $ 27.88% 377,800,682 $ 28.68% 2 612 5,160,037 $ 0.38% 5,160,037 $ 0.39% 3 613 1,225,658 $ 0.09% 1,225,658 $ 0.09% 4 617 79,874 $ 0.01% 79,874 $ 0.01% 5 620 629,024 $ 0.05% 629,024 $ 0.05% 6 621 179,174,263 $ 13.22% 179,174,263 $ 13.60% 7 622 1,198,071 $ 0.09% 1,198,071 $ 0.09% 8 623 156,979,496 $ 11.59% 156,979,496 $ 11.92% 9 624 192,453,641 $ 14.20% 192,453,641 $ 14.61% 10 625 3,187,081 $ 0.24% 3,187,081 $ 0.24% 11 626 59,229,608 $ 4.37% 59,229,608 $ 4.50% 12 632 140,914,919 $ 10.40% (19,163,919) $ 121,751,001 $ 9.24% 13 633 121,519,285 $ 8.97% 121,519,285 $ 9.22% 14 634 94,742,567 $ 6.99% (18,407,424) $ 76,335,143 $ 5.79% 15 641 2,356,647 $ 0.17% 2,356,647 $ 0.18% 16 642 83,773 $ 0.01% 83,773 $ 0.01% 17 644 1,862,949 $ 0.14% 1,862,949 $ 0.14% 18 650 8,864,654 $ 0.65% 8,864,654 $ 0.67% 19 655 917,431 $ 0.07% 917,431 $ 0.07% 20 660 2,221,152 $ 0.16% 2,221,152 $ 0.17% 21 Interdepartmental 4,399,188 $ 0.32% 4,399,188 $ 0.33% 22 Total 1,355,000,000 $ 100.00% (37,571,343) $ 1,317,428,657 $ 100.00% Transmission Allocator - Base Rate Revenue Requirement
Proposed cost allocation - distribution
19 Line No. (A) (B) (C) (D) (E) (F) Rate Code Base Rate Revenue Requirement (Cause No. 43969 - Exhibit C) % of Total Transmission Customer Adjustment Base Rate Revenue Requirement adjusted for Transmission Customers % of Total 1 611 377,800,682 $ 27.88% 377,800,682 $ 37.86% 2 612 5,160,037 $ 0.38% 5,160,037 $ 0.52% 3 613 1,225,658 $ 0.09% 1,225,658 $ 0.12% 4 617 79,874 $ 0.01% 79,874 $ 0.01% 5 620 629,024 $ 0.05% 629,024 $ 0.06% 6 621 179,174,263 $ 13.22% 179,174,263 $ 17.96% 7 622 1,198,071 $ 0.09% 1,198,071 $ 0.12% 8 623 156,979,496 $ 11.59% 156,979,496 $ 15.73% 9 624 192,453,641 $ 14.20% 192,453,641 $ 19.29% 10 625 3,187,081 $ 0.24% 3,187,081 $ 0.32% 11 626 59,229,608 $ 4.37% 59,229,608 $ 5.94% 12 632 140,914,919 $ 10.40% (140,914,919) $
- $
0.00% 13 633 121,519,285 $ 8.97% (121,519,285) $
- $
0.00% 14 634 94,742,567 $ 6.99% (94,742,567) $
- $
0.00% 15 641 2,356,647 $ 0.17% 2,356,647 $ 0.24% 16 642 83,773 $ 0.01% 83,773 $ 0.01% 17 644 1,862,949 $ 0.14% 1,862,949 $ 0.19% 18 650 8,864,654 $ 0.65% 8,864,654 $ 0.89% 19 655 917,431 $ 0.07% 917,431 $ 0.09% 20 660 2,221,152 $ 0.16% 2,221,152 $ 0.22% 21 Interdepartmental 4,399,188 $ 0.32% 4,399,188 $ 0.44% 22 Total 1,355,000,000 $ 100.00% (357,176,771) $ 997,823,229 $ 100.00% Distribution Allocator - Base Rate Revenue Requirement
Projected rate impacts – total revenue
20
2014 2015 2016 2017 2018 2019 2020 Total 611 0.1 2.0 5.4 10.9 16.7 23.5 32.8 91.4 $ 612 0.0 0.0 0.1 0.1 0.2 0.3 0.4 1.2 $ 613 0.0 0.0 0.0 0.0 0.1 0.1 0.1 0.3 $ 617 0.0 0.0 0.0 0.0 0.0 0.0 0.0 0.0 $ 620 0.0 0.0 0.0 0.0 0.0 0.0 0.1 0.2 $ 621 0.0 0.9 2.6 5.2 7.9 11.2 15.6 43.3 $ 622 0.0 0.0 0.0 0.0 0.1 0.1 0.1 0.3 $ 623 0.0 0.8 2.3 4.5 6.9 9.8 13.6 38.0 $ 624 0.0 1.0 2.8 5.6 8.5 12.0 16.7 46.6 $ 625 0.0 0.0 0.0 0.1 0.1 0.2 0.3 0.8 $ 626 0.0 0.3 0.8 1.7 2.6 3.7 5.1 14.3 $ 632 0.0 0.2 0.5 1.0 1.4 2.1 2.9 8.2 $ 633 0.0 0.2 0.5 1.0 1.4 2.0 2.9 8.1 $ 634 0.0 0.1 0.3 0.6 0.9 1.3 1.8 5.1 $ 641 0.0 0.0 0.0 0.1 0.1 0.1 0.2 0.6 $ 642 0.0 0.0 0.0 0.0 0.0 0.0 0.0 0.0 $ 644 0.0 0.0 0.0 0.1 0.1 0.1 0.2 0.5 $ 650 0.0 0.0 0.1 0.3 0.4 0.6 0.8 2.1 $ 655 0.0 0.0 0.0 0.0 0.0 0.1 0.1 0.2 $ 660 0.0 0.0 0.0 0.1 0.1 0.1 0.2 0.5 $ Total 0.2 $ 5.7 $ 15.6 $ 31.3 $ 47.7 $ 67.3 $ 94.0 $ 261.7 $
Estimated Revenues Customer Rate Class
Estimated Revenue Requirement Based on 7-Year Electric TDSIC Plan (in millions)
Projected rate impacts – typical bills
21
Overall timeline
22
2013 2014 2015
7 8 9 10 11 12 1 2 3 4 5 6 7 8 9 10 11 12 1 2 3 4 5 6 7 8 9 10 11 12
Seven Year Plan Petition Tracker/Deferral Shell Petition Tracker Filing #1 Tracker Filing #2 Tracker Filing #3 Spend Period #1 Spend Period #2 Spend Period #3 Spend Period #4
Closing Period Closing Period Closing Period
QUESTIONS?
23