state child death review board
play

STATE CHILD DEATH REVIEW BOARD 2012 ANNUAL REPORT OVERVIEW (2010 - PDF document

STATE CHILD DEATH REVIEW BOARD 2012 ANNUAL REPORT OVERVIEW (2010 Data) The State Child Death Review Board (SCDRB) was created by the Kansas Legislature in 1992, and is administered by the Office of the Kansas Attorney General. The Boards


  1. STATE CHILD DEATH REVIEW BOARD 2012 ANNUAL REPORT OVERVIEW (2010 Data) The State Child Death Review Board (SCDRB) was created by the Kansas Legislature in 1992, and is administered by the Office of the Kansas Attorney General. The Board’s membership is comprised of ten-volunteer members 
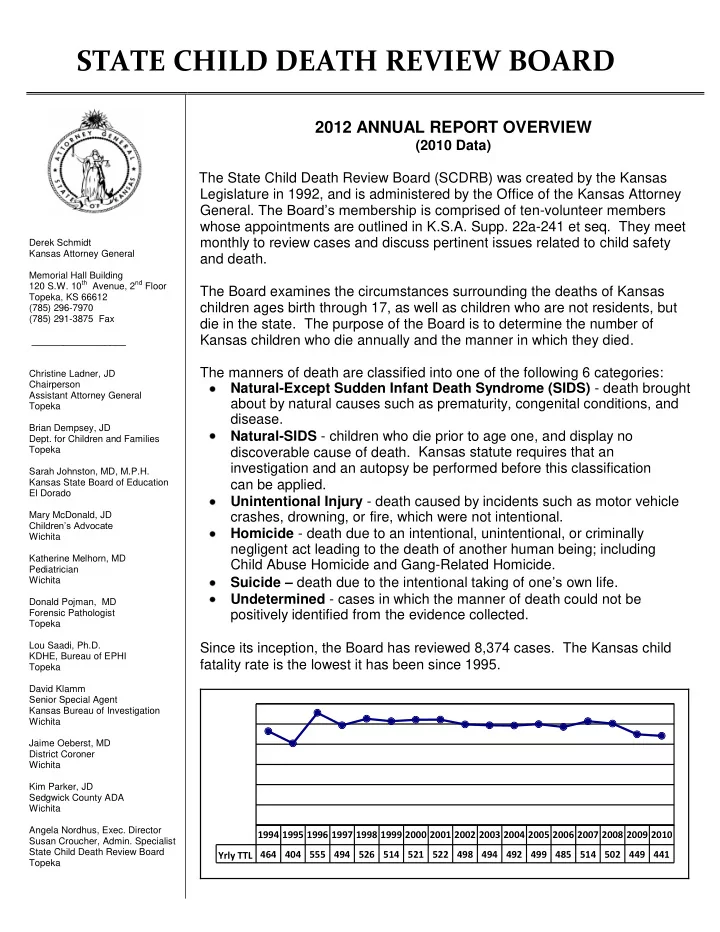
whose appointments are outlined in K.S.A. Supp. 22a-241 et seq. They meet monthly to review cases and discuss pertinent issues related to child safety Derek Schmidt Kansas Attorney General and death. Memorial Hall Building 120 S.W. 10 th Avenue, 2 nd Floor The Board examines the circumstances surrounding the deaths of Kansas Topeka, KS 66612 children ages birth through 17, as well as children who are not residents, but (785) 296-7970 (785) 291-3875 Fax die in the state. The purpose of the Board is to determine the number of Kansas children who die annually and the manner in which they died. __________________ The manners of death are classified into one of the following 6 categories: Christine Ladner, JD Chairperson Natural-Except Sudden Infant Death Syndrome (SIDS) - death brought Assistant Attorney General about by natural causes such as prematurity, congenital conditions, and Topeka disease. Brian Dempsey, JD Natural-SIDS - children who die prior to age one, and display no Dept. for Children and Families Topeka discoverable cause of death. Kansas statute requires that an investigation and an autopsy be performed before this classification Sarah Johnston, MD, M.P.H. Kansas State Board of Education can be applied. El Dorado Unintentional Injury - death caused by incidents such as motor vehicle Mary McDonald, JD crashes, drowning, or fire, which were not intentional. Children’s Advocate Homicide - death due to an intentional, unintentional, or criminally Wichita negligent act leading to the death of another human being; including Katherine Melhorn, MD Child Abuse Homicide and Gang-Related Homicide. Pediatrician Suicide – death due to the intentional taking of one ’s own life. Wichita Undetermined - cases in which the manner of death could not be Donald Pojman, MD Forensic Pathologist positively identified from the evidence collected. Topeka Lou Saadi, Ph.D. Since its inception, the Board has reviewed 8,374 cases. The Kansas child KDHE, Bureau of EPHI fatality rate is the lowest it has been since 1995. Topeka David Klamm Senior Special Agent Kansas Bureau of Investigation Wichita Jaime Oeberst, MD District Coroner Wichita Kim Parker, JD Sedgwick County ADA Wichita Angela Nordhus, Exec. Director 1994 1995 1996 1997 1998 1999 2000 2001 2002 2003 2004 2005 2006 2007 2008 2009 2010 Susan Croucher, Admin. Specialist State Child Death Review Board Yrly TTL 464 404 555 494 526 514 521 522 498 494 492 499 485 514 502 449 441 Topeka

  2. In 2010, there were 441 fatalities of children under the age of 18. The majority (68%) were from natural causes, with one-fifth (21%) from unintentional injury. The board was unable to determine a cause of death for three percent of the total deaths. Emphasis has been 2010 Data placed on infant mortality (age less than one-year) < 29 days 171 as an area in need of 30 days – 1 yr 86 improvement. Although 1 – 4 years 65 the rate of infant deaths 5 – 9 years 36 per 1,000 live births 10 – 14 years 25 decreased to 6.4 in 2010, after reaching 8.2 in 15 – 17 years 58 2007, it is still above the national 6.0 goal as defined by the U.S. Male 260 Department of Health and Female 181 Human Services Healthy People 2020 target. It is worth noting that 39% of the total fatalities in 2010 were less than 29 days old; 58% of the total was less than 1 year old. The majority of the fatalities were males. When reviewing the last five years of natural deaths by weeks gestation at birth of children who died less than one year of age, the majority (64%) were less than 32 weeks of age. Here is a breakdown by weeks gestation (page 9 of 2012 Annual Report): Weeks Gestation 2006 2007 2008 2009 2010 <32 weeks 147 171 150 145 120 33 – 34 weeks 14 15 13 6 10 35 – 36 weeks 17 15 20 14 25 >= 37 weeks 51 50 59 55 47 Not listed 1 0 2 2 0

  3. Since 2007, deaths from prematurity have steadily decreased. However, prematurity remains the highest cause of natural deaths. In 2010, it comprised 40% of the total natural deaths. Congenital malformation was the second highest cause (22%) followed by metabolic/genetic disorders (12%). The State of Kansas Genetics Plan released August 19, 2010, notes that “genetics expertise in the state is currently insufficient to meet clinical and patient needs” and calls for continuing education for primary care physicians to enable them to discuss the impact of genetics on health outcomes. For the entire genetics plan, visit http://www.kdheks.gov/newborn_screening/download/State_Genetics_Plan.pdf. Rate of Infant Deaths for Three Leading Causes of Death Kansas, 2005-2010 Rate per 1,000 Live Births Prematurity Congenital Malformation Metabolic/Genetic 2005 2006 2007 2008 2009 2010 Death rates for Black children were higher than for White children for each manner of death except Suicide, with the greatest discrepancy in the SIDS category. Relative Rates of Death, Ages 0-17, by Race Kansas, 2005-2010 Natural - Except SIDS Natuarl - SIDS White Unintentional Injury Black Homicide Suicide 0 1 2 3 4 Relative rate was calculated by dividing the death rate for each race by the White (reference group) rate.

  4. There were 40 Sudden Infant Death Syndrome (SIDS) cases in Kansas in 2010. The majority (78%) were less than 3 months of age. Eighty percent of the fatalities occurred at the decedent ’ s residence with 10% occurring in a daycare. It was reported that 50% were placed to sleep on their back and 38% were placed in a crib to sleep. Since 2005, the SIDS fatality rate had remained moderately steady with a slight decrease in 2009. SIDS Rates by Age, 2005-2010 SIDS Rates , 2005-2010 Per 1,000 live births 2 75 1.5 50 1 25 0.5 0 0 <30 1 m 2 m 3 m 4m 5m 6m 7m 8m 9m 10m 11m 2005 2006 2007 2008 2009 2010 The Board follows the CJ Foundation ’ s definition of SIDS and sub-classifications when making a SIDS determination. For more information visit http://www.cjsids.org/ . 2010 SIDS Classification 6 = SIDS IA: Two of the six infants were placed and found prone; three were placed prone and found supine, and placement in one case was unknown, but was found prone. 1 = SIDS IB: The scene investigation was inadequate as it did not contain information about how the infant was placed to sleep or the sleeping environment. 33 = SIDS II: In all of these cases, the possibility of an overlay or mechanical asphyxia could not be ruled out. 1 = USID: The Board classified this case as Undetermined because the child was embalmed prior to autopsy. The Board has significant concern about the number of SIDS deaths classified as Category II. Most Category II deaths are classified as such due to the inability to definitively eliminate the possibility of overlay or mechanical asphyxia as a cause of death. These are babies sleeping with parents or siblings, placed to sleep on soft surfaces, or with excessive bedding or pillows in the sleep environment. Although these cases are suitable to classify as SIDS, the possibility exists that some of the deaths are due to overlay by a parent, or mechanical asphyxia from bedding or pillows. The large number of infants who sleep in less than ideal circumstances is a continued concern for the Board.

  5. Overall death rates for children ages 1-17 have shown a slight decline from 1994 to 2010. There were 183 deaths in this age group in 2010 and the below chart outlines the manners in which they died. Number of Deaths, Ages 0-17, by Cause of Death by Age Group Kansas, 2010 30 27 25 Age < 1 20 Age 1-4 15 15 Age 5-9 12 10 10 Age 10-14 6 6 6 Age 15-17 4 5 3 3 3 3 3 2 2 1 1 1 0 0 0 0 0 0 0 0 Motor Vehicle Drowning Fire Homicide Suicide Although the number of child homicides dropped from preceding years in 2010, they continue to remain a concern. The lowest number of homicide deaths (12) occurred in 2005. In 2006, they steadily increased until peaking in 2009, and then dropped to 17 in 2010. Between the years of 2005 – 2010, there were a total of 118 homicides, and over half of those were children under the age of four. Forty percent of the total 118 involved a firearm and 45% were the result of Abusive Head Trauma (AHT) commonly referred to as Shaken Baby Syndrome. In 2010, the majority of homicides were child abuse related. Year Weapon Asphyxia Fire/Burn AHT/Child Abuse Other 2005 4 0 0 8 0 2006 5 1 1 7 1 2007 8 1 0 7 3 2008 10 1 0 13 2 2009 16 2 0 10 1 2010 6 1 1 8 1 In 2010, the SCDRB recommended the following Public Policy Recommendations to lower child fatalities: Improve preconception health; Increase awareness of Pertussis vaccinations for all caregivers; Strengthen partnerships to improve public education purposes; Enact laws pertaining to children left unattended in vehicles; Improve All Terrain Vehicle (ATV) usage laws; Strengthen laws regarding the Farm Permit driving license; and Continue comprehensive investigations of child deaths.

Download Presentation
Download Policy: The content available on the website is offered to you 'AS IS' for your personal information and use only. It cannot be commercialized, licensed, or distributed on other websites without prior consent from the author. To download a presentation, simply click this link. If you encounter any difficulties during the download process, it's possible that the publisher has removed the file from their server.

Recommend


More recommend