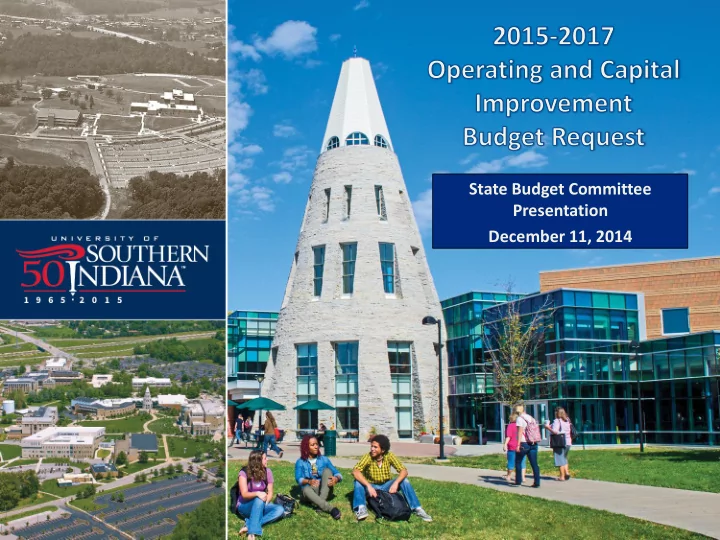

State Budget Committee Presentation December 11, 2014
9,364 Students Enrolled Fall 2014 84% of Students from 89 Indiana Counties 1 in 4 Students is 25 Years Old or Older 30% are First Generation Students
12% of Students are Minorities or from Other Countries 25% of Students Live on Campus “Core 39” First-Year Experience Course
• 3,000 Students Focused on Programs in Nursing and Health Professions • Major Grant to Strengthen Inter-Professional Education Expansion and Renovation of Health Facility in Capital Request
• Engineering Degree Program • Southern Indiana STEM Resource Center • Partnership with Crane Naval Warfare Center • Technology Commercialization Academy
AFFORDABILITY 2014 2014-20 2015 15 TUITION N AND FEES 4-YEAR PUBLI LIC INSTITUT UTIONS IONS IN INDIANA IANA $10,441 IU - Bloomington $10,002 PU West Lafayette $9,344 Ball State IUPUI $8,909 State Average $8,519 Indiana State $8,416 $7,506 PU Regional $6,836 IU Regional USI $6,697 Tuitio ion n and fees cover two 15 credit it-hour-semesters rs
PERFORMANCE METRICS PERFORMANCE FOR 3-YEAR PERCENT COMPARISON PERIOD CHANGE Overall Degree Completion 14.5% Increase On-Time Graduation in 4 Years 13.2% Increase At-Risk Degree Completion 40.1% Increase Overall Student Persistence 6.5% Increase Affordability Performance Metric 5.3% Decrease
2015-2017 USI PERFORMANCE FUNDING FORMULA IMPACT • Overall Degree Completion $ 1,300,000 • On-Time Graduation Rate 851,000 • At-Risk Degree Completion 654,000 • Student Persistence Incentive 193,300 150,000 • Institution-Defined Productivity Metric $ 3,148,300 Total Performance Funding Performance Funding Metrics with No Adjustment to Unit Values
IMPACT OF PROPOSED PFF 7% and 8% FY16 and FY17 2014-2015 Operating 2014-2015 Operating $44,146,854 $44,146,854 Appropriation Base Appropriation Base 4% Base Reallocation $1,765,874 5% Base Reallocation $2,207,343 Performance Funding Performance Funding $2,294,732 $2,623,682 Impact – Unit Adjusted Impact – Unit Adjusted 2015-2016 Operating 2016-2017 Operating $44,675,712 $44,563,193 Appropriation Appropriation Net Impact of PFF $528,854 Net Impact of PFF $416,339 Percent Change in Base 1.2% Percent Change in Base 0.9%
2015-2017 CAPITAL BUDGET REQUEST Classroom Renovation $8,000,000 and Expansion – Health Professions Center Multi-Institutional $7,300,000 Academic Health Science/Research Center General Repair and $3,597,873 Rehabilitation and Infrastructure Funding Nursing and Health Professions Center
2015-2017 LINE ITEM REQUEST 2015-2016 2016-2017 LINE ITEM APPROPRIATION APPROPRIATION Historic New Harmony $535,566 $535,566 STEM Initiatives $2,000,000 $2,000,000 Technical and High Priority $320,450 $320,450 Dual Credit Hours
IMPACT OF DUAL CREDIT TO ON-TIME GRADUATION - 2012-2013 WITH CREDIT 59% 34% 7% NO CREDIT 28% 52% 20% 0% 20% 40% 60% 80% 100% 4 Years or Less 5-6 Years 7 Years or More
Recommend
More recommend