SLIDE 1
VCS Potatoes Limited 2 Burnt Cottages, Badingham road, Framlingham, Suffolk IP13 9HX Tel: 07768 030003 email: graham@vcsagronomy.com
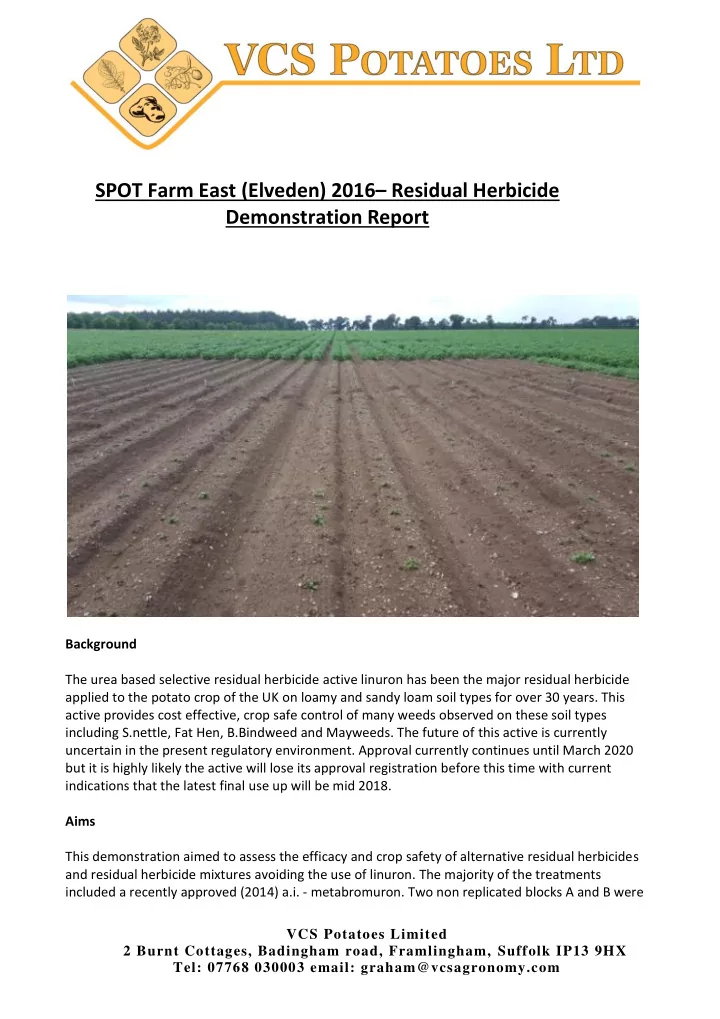
SPOT Farm East (Elveden) 2016– Residual Herbicide Demonstration Report
Background The urea based selective residual herbicide active linuron has been the major residual herbicide applied to the potato crop of the UK on loamy and sandy loam soil types for over 30 years. This active provides cost effective, crop safe control of many weeds observed on these soil types including S.nettle, Fat Hen, B.Bindweed and Mayweeds. The future of this active is currently uncertain in the present regulatory environment. Approval currently continues until March 2020 but it is highly likely the active will lose its approval registration before this time with current indications that the latest final use up will be mid 2018. Aims This demonstration aimed to assess the efficacy and crop safety of alternative residual herbicides and residual herbicide mixtures avoiding the use of linuron. The majority of the treatments included a recently approved (2014) a.i. - metabromuron. Two non replicated blocks A and B were
SLIDE 2
planted on different dates. Block A planted 21st April to correspond with traditional planting dates and Block B 27th May to allow comparison later in the season to coincide an open day - 5th July. Site Details The demonstration site - Lodge Warren was a loamy sand. Block A and Block B were planted with Maris piper with an identical seed stock (Scotch S FG5 97484-7090) the stock was treated with Storite Super (thiabendazole and imazalil) post harvest and in addition the seed was treated with Monceren DS (pencycuron) @ 1kg/T at planting. Region West Suffolk Field Name Lodge Warren Soil type Loamy sand Variety Maris Piper Fertiliser Applications Soil Information Soil Index Available Nutrients from FYM application kg/ha Base Fertiliser Applied kg/ha Top Dressing Applied kg/ha Nitrogen 4 140 70 Phosphate 3 61 50 Potash 2- 174 230 Magnesium 1 30 80 pH 7.8 70 Application details Block A Block B
Planting Date
21st April 27th May
Application date
13-14th May 6th June
Ground Cover assessment
1st June 22nd June
Weed counts
13th June 4th July The treatments were identical on both Block A and Block B
SLIDE 3
Treatment List Trt No. Water Volume Herbicide Application Cost £/ha 1 300 l/ha STANDARD Afalon (linuron 500g/l) 1.35l + Stomp Aqua (pendimethalin 455g/l) 2.2 l/ha + Shotput (metribuzin 70%) 200g/ha £34 2 200 l/ha Praxim (metobromuron 50g/l) 3l + Shotput (metribuzin 70%) 300g/ha £63 3 200 l/ha Praxim (metobromuron 500g/l) 3l + Stomp Aqua (pendimethalin 455g/l) 2.2 l/ha £73 4 200 l/ha Praxim (metobromuron 500g/l) 3l/ha + Defy (prosulfocarb800g/l) 4l/ha £82 5 200 l/ha Praxim (metobromuron 500g/l) 3 l/ha + Artist (metribuzin 17.5% + flufenacet 24%) 1 kg/ha £83 6 200 l/ha Praxim (metobromuron 500g/l) 2 l/ha + Stomp Aqua (pendimethalin 455g/l) 2.2 l/ha + Shotput (metribuzin 70%) 200 g/ha £59 7 200 l/ha Praxim (metobromuron 500g/l) 2 l/ha + Stomp Aqua (pendimethalin 455g/l) 2.2 l/ha + Gamit 36SC (clomazone 360 g/l) 125ml/ha £63 8 200 l/ha Praxim (metobromuron 500g/l) 2 l/ha + Defy (prosulfocarb800g/l) 3l/ha + Shotput (metribuzin 70%) 200 g/ha £61 9 200 l/ha Defy (prosulfocarb800g/l) 4l/ha £26 10 200 l/ha Praxim (metobromuron 500g/l) 4l/ha £74 11 200 l/ha Stomp Aqua (pendimethalin 455g/l) 2.9 l/ha £23 12 200 l/ha Shotput (metribuzin 70%) 500g/ha £12
Figure 1 : Treatments and Costing
Note: diquat 3l/ha + NI Wetter 200ml/ha applied in addition to all above applications Demonstration Plan
SLIDE 4
Figure 2 : Demonstration Plan
SLIDE 5
Observations – Block A Assessments of ground cover, Figure 3 and weed counts, Figure 4 were undertaken on Block A
Figure 3 : Block A Ground cover % 1st June Figure 4 : Block A Weed count assessments 2x1.5m Bed 13th June
5 10 15 20 25 Trt 1 Trt 2 Trt 3 Trt 4 Trt 5 Trt 6 Trt 7 Trt 8 Trt 9 Trt 10 Trt 11 Trt 12 Ground cover %
5 10 15 20 25 30 35 40 45 Trt 1 Trt 2 Trt 3 Trt 4 Trt 5 Trt 6 Trt 7 Trt 8 Trt 9 Trt 10 Trt 11 Trt 12 Cleavers Groundsel S.Nettle B.bindweed Fat hen Flixweed
SLIDE 6
Observations – Block B Assessment of ground cover, Figure 5 and weed counts, Figure 6 were undertaken on Block B
Figure 5 : Ground cover % 22nd June Figure 6 : Block B Weed count assessments 2x1.5m Bed 4th July
No phytoxicity was observed for any treatments within Block A, assessment 1st June and Block B, assessment 22nd June. These assessments occurred at approximately 20% ground cover for all plots. However minor veinal yellowing (characteristic of metribuzin uptake) was observed on Trt 12 Block A on 7th June.
5 10 15 20 25 30 Trt 1 Trt 2 Trt 3 Trt 4 Trt 5 Trt 6 Trt 7 Trt 8 Trt 9 Trt 10 Trt 11 Trt 12 Ground cover % 10 20 30 40 50 60 70 80 90 100 Trt 1 Trt 2 Trt 3 Trt 4 Trt 5 Trt 6 Trt 7 Trt 8 Trt 9 Trt 10 Trt 11 Trt 12 Cleavers Groundsel S.Nettle B.bindweed Fat hen AMG
SLIDE 7
Discussion Comparison of the ground cover assessments on block A and B suggest no restrictions to crop growth from any of the residual herbicide applications treatments. An untreated area, Figure 7, allowed an assessment of weed species present on the site, these were dominated by groundsel, cleavers, s.nettle and annual meadow grass (AMG). Weed species present at lower levels include fathen, flixweed, b.bindweed, field pansy and cranesbill. It was considered only the weed species present at higher levels allow a comparison of efficacy from the various treatments within this demonstration. Untreated Area
Figure 7 : Untreated area
SLIDE 8 Assessments - Groundsel The observed total weed count of groundsel from block A and B, Figure 7 reveals variation between treatments
Figure 7 : Groundsel counts Total 3m Bed block A & B
Best Performance
Trt 12 Shotput (metribuzin 70%) 500g/ha (Figure 8 A) Trt 5 Praxim (metobromuron 500g/l) 3l/ha + Artist (metribuzin 225g/kg, flufenacet 240g/kg) 1kg/ha Trt 1 Afalon (linuron 500g/l) 1.2 l/ha + Stomp Aqua (pendimethalin 455g/l) 2.2 l/ha + Shotput (metribuzin 70%) 200g/ha
Worst Performance
Trt 11 Stomp Aqua (pendimethalin 455g/l) 2.9 l/ha (Figure 8 B) Trt 3 Praxim (metobromuron 500g/l) 3l/ha + Stomp Aqua (pendimethalin 455g/l) 2.2 l/ha Trt 10 Praxim (metobromuron 500g/l) 4l/ha Figure 8 A & B : Trt 12 and Trt 11 Block A 14th June
The results indicate the level of metribuzin applied has the largest influence on the residual control
- f groundsel within this demonstration. Clomozone in a 3 way combination also provided good
control of groundsel.
20 40 60 80 100 120 140 Trt 1 Trt 2 Trt 3 Trt 4 Trt 5 Trt 6 Trt 7 Trt 8 Trt 9 Trt 10 Trt 11 Trt 12 Weed Number 2x1.5m Bed
SLIDE 9
Assessments - S.Nettle The observed total weed count of s.nettle from block A and B, Figure 9 reveals variation between treatments
Figure 9 : S.Nettle counts Total 3m Bed block A & B
Best Performance
Trt 1 Afalon (linuron 480 g/l) 1.35 l/ha + Stomp Aqua(pendimethalin 455g/l) 2.2 l/ha + Shotput (metribuzin70%) 200g/ha (Figure 10A) Trt 6 Praxim (metobromuron 500g/l) 3l/ha + Stomp Aqua(pendimethalin 455g/l) 2.2 l/ha + Shotput (metribuzin70%) 200g/ha Trt 11 Stomp Aqua (pendimethalin 455g/l) 2.9 l/ha
Worst Performance
Trt 9 Defy (prosulfocarb 800 g/l) 4l/ha (Figure 10B) Trt 4 Praxim (metobromuron 500g/l) 3l/ha + Defy (prosulfocarb 800 g/l) 4l/ha Trt 10 Praxim (metobromuron 500g/l) 4l/ha Figure 10 A & B : Trt 1 and Trt 9 Block A 14th June
The results indicate the application of pendimethalin has the largest influence on the residual control of S.nettle
10 20 30 40 50 60 Trt 1 Trt 2 Trt 3 Trt 4 Trt 5 Trt 6 Trt 7 Trt 8 Trt 9 Trt 10 Trt 11 Trt 12 Weed Number 2x1.5m Bed
SLIDE 10
Assessments – Cleavers The observed total weed count of cleavers from block A and B, Figure 10 reveals variation between treatments
Figure 11 : Cleaver counts Total 3m Bed block A & B
Best Performance
Trt 8 Praxim (metobromuron 500g/l) 2l/ha + Defy (prosulfocarb 800 g/l) 3l/ha + Shotput (metribuzin70%) 200g/ha (Figure 12A) Trt 9 Defy (prosulfocarb 800 g/l) 4l/ha Trt 4 Praxim (metobromuron 500g/l) 3l/ha + Defy (prosulfocarb 800 g/l) 4l/ha
Worst Performance
Trt 12 Shotput (metribuzin 70%) 500g/ha (Figure 12B) Trt 6 Praxim (metobromuron 500g/l) 2l/ha + Stomp Aqua (pendimethalin 455g/l) 2.2 l/ha + Shotput (metribuzin 70%) 200g/ha Trt 10 Praxim (metobromuron 500g/l) 4l/ha Figure 12 A & B : Trt 8 and Trt 12 Block A 14th June
The results indicate prosulfocarb is likely to have the greatest influence on control although considerable variation occurred across the trial with the greatest level of cleavers occurring on one side of the trial which may have affected the results
5 10 15 20 25 30 35 40 Trt 1 Trt 2 Trt 3 Trt 4 Trt 5 Trt 6 Trt 7 Trt 8 Trt 9 Trt 10 Trt 11 Trt 12 Weed Number 2x1.5m Bed
SLIDE 11
Assessments - Annual Meadow Grass (AMG)
Figure 13 : Cleaver counts Total 3m Bed block A & B
Best Performance
All treatments except 9 & 10
Worst Performance
Trt 11 Stomp Aqua (pendimethalin 455g/l) 2.9 l/ha (Figure 14 B) Trt 9 Defy (prosulfocarb 800 g/l) 4l/ha Figure 14 A & B : Trt 5 and Trt 11 Block A 14th June
The results indicate good control of AMG by many of the combination treatments. AMG is susceptible to metribuzin pre-emergence and results indicated no AMG within treatments containg product/combinations with metribuzin. Other treatments without metribuzin also indicate some activity from metobromuron (Trt 10, Trt 2)
2 4 6 8 10 12 14 16 18 20 Trt 1 Trt 2 Trt 3 Trt 4 Trt 5 Trt 6 Trt 7 Trt 8 Trt 9 Trt 10 Trt 11 Trt 12 Weed Number 2x1.5m Bed
SLIDE 12 Conclusions The weed spectrum on this site was more limited than expected with only low levels of B.Bindweed, Fathen and Mayweed observed allowing no comparison of treatment performance with respect to these problematic weeds. High levels of Groundsel, Cleavers, S.nettle, AMG and Flixweed (Block A only) were observed allowing a comparison of the treatments with regard to control of these weeds. The applications of individual a.i.’s allowed assessment of the strengths and weakness of the a.i. within this demonstration, Figure 15, with respect to the individual weeds present however it should be noted this was a non replicated demonstration and these are trends observed. Validation
- f these observations would require replicated trials within multiple sites and ideally more than one
season.
Active Ingredient Weeds metribuzin metobromuron prosulfocarb pendimethalin clomazone S.nettle 2 m.susceptible m.susceptible
- susceptible
- Cleavers
- susceptible
- m.susceptible
Groundsel susceptible L.susceptible
Flixweed
m.susceptible*
susceptible susceptible
- Figure 15 : Comparison of A.I. performance
The best overall performance was observed with treatments 5 (metabromuron, metribuzin and flufenacet) and treatment 8 (metobromuron, prosulfocarb and metribuzin), Figure 16. The inclusion
- f three active substances provided a broader weed spectrum control compared to the application
- f two active substances
Figure 16 : A: Treatment 5 B: Treatment 8
SLIDE 13
However treatment 5 and 8 were expensive options, Figure 1, £83/ha and £61/ha respectively and an adequate level of weed control was observed by a number of treatments including the standard treatment 1 (linuron, pendimethalin and metribuzin, £34/ha) within the demonstration. It should be noted all the above observations and assessments have been assessed from a demonstration block and replication of the treatments over a number of sites would be required to validate the trends observed.
Acknowledgements
VCS Potatoes Ltd would like to thank Elveden Farms, VCS (UK) Ltd and AHDB Potatoes for their assistance with this trial. G.Tomalin VCS Potatoes Ltd 22nd December 2016
SLIDE 14
VCS Potatoes Limited 2 Burnt Cottages, Badingham road, Framlingham, Suffolk IP13 9HX Tel: 07768 030003 email: graham@vcsagronomy.com
SPOT Farm East (Elveden) 2017– Residual and Post- emergence Contact Herbicide Demonstration Report
Background The urea based selective residual herbicide active linuron has been the major residual herbicide applied to the potato crop of the UK on loamy and sandy loam soil types for over 30 years. This active provides cost effective, crop safe control of many weeds observed on these soil types including S.nettle, Fat Hen, B.Bindweed and Mayweeds. This active is now being revoked, the final date for sales was 3rd June 2017 with a last date for application 3rd June 2018. Aims This demonstration aimed to assess the efficacy and crop safety of alternative residual herbicides and residual herbicide mixtures avoiding the use of linuron. Following the revocation date for Linuron, two of the remaining actives are varietal dependant in their phyto-toxitcy charcterisitcs – metribuzin, clomazone. The demonstration also assessed the crop safety of the herbicides with regard to twenty three popular varieties grown in the UK. In addition when the crop was 15cm height a post emergence herbicide was applied to 3 plots. The planting and residual herbicide application dates were later than standard application timings to coincide with an open day in early July
SLIDE 15 Site Details The demonstration site – Bishop Hill Middle was a loamy sand. The complete trial was planted on xx
- April. The seed size of the different varieties varied from 35x45mm, 45x55mm and 55x60mm. All
the seed was treated with Monceren DS (pencycuron) @ 1kg/T at planting. Region West Suffolk Field Name Bishops Hill Middle Soil type Loamy sand Fertiliser Applications Soil Information Soil Index Available Nutrients from FYM application kg/ha Base Fertiliser Applied kg/ha Top Dressing Applied kg/ha Nitrogen 4 102.5 131 Phosphate 3 61 50 Potash 1 174 270 Magnesium 1 30 70 pH 7.8 Varieties Category Varieties
Processing Varieties
- R. Burbank, Royal, Daisy, Performer, Challenger, Shepody, Innovator, Forza
Prepack Varieties
Lanorma, Soraya, Jelly, Marfona, Nectar, Vales sovereign, Saxon, Melody
Crisping Varieties
Brooke
Salad Varieties
Maris Peer, Leontine
Ware Varieties
Maris Piper, Eurostar, Rooster, Markies Application details Date
Planting Date
21st April
Application date – Pre emergence Residual Herbicides
13-14th May
Application Date – Contact Herbicides
20th June
Weed count 1
15th June
Weed count 2
3rd July
Weed count 3 (full plot)
31st August
SLIDE 16
Treatment List Trt No. Water Volume Herbicide Application 1. 30th May pre emergence Herbicide Application 2. 20th June @ 15cm crop height Residual Cost £/ha 1 300 l/ha Untreated £0 2 200 l/ha VCS 1717 2.5 l/ha + Retro 3l/ha + NI wetter TBC 3 200 l/ha Stomp Aqua 2.8 l/ha +Retro 3l/ha + NI Wetter £22 4 200 l/ha Praxim 4l/ha Retro 3l/ha + NI Wetter £72 5 200 l/ha Gamit 25EC 200ml/ha + Retro 3l/ha + NI Wetter £15 6 200 l/ha Flufenacet 600g/ha A.I. + Retro 3l/ha + NI Wetter TBC 7 200 l/ha Artist 1.2 kg/ha + Stomp Aqua 2l/ha + Retro 3l/ha + NI Wetter £45 8 200 l/ha Praxim 2.5 l/ha + Stomp Aqua 2 l/ha + shotput 200g/ha + Retro 3l/ha + NI Wetter £66 9 200 l/ha Praxim 2.5 l/ha + Defy 3l/ha + Shotput 200 g/ha + Retro 3l/ha + NI Wetter £71 10 200 l/ha Stomp Aqua 2 l/ha + Shotput 400g + Retro 3l/ha + NI Wetter £26 11 200 l/ha STANDARD Afalon 1.35l + Stomp Aqua 2 l/ha + Shotput 200g + Retro 3l/ha + NI Wetter £33 12 200 l/ha Shotput 600g + Retro 3l/ha + NI Wetter £14 13 200 l/ha Shotput 600g + Retro 3l/ha + NI Wetter Irrigated 15mm 20 hours post app £14 14 200 l/ha STANDARD Afalon 1.35l + Stomp Aqua 2 l/ha + Shotput 200g + Retro 3l/ha + NI Wetter Shotput 200g/ha £33+£5 15 200 l/ha STANDARD Afalon 1.35l + Stomp Aqua 2 l/ha + Shotput 200g + Retro 3l/ha + NI Wetter Shotput 500g/ha £33+£12 16 200 l/ha STANDARD Afalon 1.35l + Stomp Aqua 2 l/ha + Shotput 200g + Retro 3l/ha + NI Wetter Titus 30g/ha + Shotput 200g/ha + NI Wetter TBC
Figure 1 : Treatments and Costing
Note: diquat 3l/ha + NI Wetter 200ml/ha co-applied with all residual applications
SLIDE 17 Demonstration Plan
Figure 2 : Demonstration Plan
Unplanted 2 m Row 1 Row 2 Row 3 Row 4 Row 5 Row 6 Row 7 Row 8 Row 9 Row 10Row 11Row 12Row 13Row 14Row 15Row 16Row 17Row 18Row 19Row 20Row 21Row 22Row 23Row 24Row 25Row 26 2m 461 462 463 464 465 466 467 468 469 470 471 472 473 474 475 476 477 478 479 480 481 482 483 484 1.5m 2m 437 438 439 440 441 442 443 444 445 446 447 448 449 450 451 452 453 454 455 456 457 458 459 460 1.5m 2m 413 414 415 416 417 418 419 420 421 422 423 424 425 426 427 428 429 430 431 432 433 434 435 436 1.5m 2m 389 390 391 392 393 394 395 396 397 398 399 400 401 402 403 404 405 406 407 408 409 410 411 412 1.5m 2m 365 366 367 368 369 370 371 372 373 374 375 376 377 378 379 380 381 382 383 384 385 386 387 388 1.5m 2m 341 342 343 344 345 346 347 348 349 350 351 352 353 354 355 356 357 358 359 360 361 362 363 364 1.5m 2m 317 318 319 320 321 322 323 324 325 326 327 328 329 330 331 332 333 334 335 336 337 338 339 340 1.5m 2m 293 294 295 296 297 298 299 300 301 302 303 304 305 306 307 308 309 310 311 312 313 314 315 316 1.5m 2m 269 270 271 272 273 274 275 276 277 278 279 280 281 282 283 284 285 286 287 288 289 290 291 292 1.5m 2m 245 246 247 248 249 250 251 252 253 254 255 256 257 258 259 260 261 262 263 264 265 266 267 268 1.5m 2m 221 222 223 224 225 226 227 228 229 230 231 232 233 234 235 236 237 238 239 240 241 242 243 244 1.5m 2m 197 198 199 200 201 202 203 204 205 206 207 208 209 210 211 212 213 214 215 216 217 218 219 220 1.5m 2m 173 174 175 176 177 178 179 180 181 182 183 184 185 186 187 188 189 190 191 192 193 194 195 196 1.5m 2m 149 150 151 152 153 154 155 156 157 158 159 160 161 162 163 164 165 166 167 168 169 170 171 172 1.5m 2m 125 126 127 128 129 130 131 132 133 134 135 136 137 138 139 140 141 142 143 144 145 146 147 148 1.5m 2m 101 102 103 104 105 106 107 108 109 110 111 112 113 114 115 116 117 118 119 120 121 122 123 124 Unplanted 2 m 2 Beds 2 Beds 2 Beds 2 Beds 2 Beds 2 Beds 2 Beds 2 Beds 2 Beds 2 Beds 2 Beds 1 Bed Tramline BLOCK A : Residual applications only BLOCK B : Residual applications + Contact applications post emergence M.piper Saxon Trt 13 Shotput 600 g/ha + equiv 20mm rainfall 12 hours post application + App 2 Shotput 500g/ha + App 2 Titus 30g/ha + Shotput 200g/ha + NI Wetter Trt 14 Linuron 1.35 l/ha + Stomp A 2.2 l/ha + Shotput 200g/ha Trt 15 Linuron 1.35 l/ha + Stomp A 2.2 l/ha + Shotput 200g/ha Trt 16 Linuron 1.35 l/ha + Stomp A 2.2 l/ha + Shotput 200g/ha + App 2 Shotput 200g/ha Trt 2. BAYER a.i. aclonifen 600g/l 2.5l/ha Trt 3. Stomp Aqua 2.8 l/ha Trt 4. Praxim 4l/ha Trt 5 Gamit EC 200ml/ha Trt 6 Flufenacet TBA Trt 7 Artist 1.2 kg/ha + Stomp Aqua 2.2l/ha Trt 8 Praxim 2l/ha + Stomp Aqua 2.2 l/ha + Shotput 200g/ha Trt 9 Praxim 2l/ha + Defy 3l/ha + Shotput 200g/ha Trt 10 Stomp 2.2 l/ha + Shotput 400 g/ha Trt 11 Linuron 1.35 l/ha + Stomp A 2.2 l/ha + Shotput 200g/ha Trt 12 Shotput 600g/ha Daisy Forza Nectar Brooke V.Sovereign Marfona Performer Eurostar Lanorma Challenger Shepody M.peer Leontine Royal Soraya Trt 1. Untreated Rooster Jelly Markies Melody Innovator Russet Burbank
SLIDE 18
Observations - Residual Herbicide Weed counts 15th June
Figure 3 : Block A Weed count assessments 2x1m Bed 15th June
Observations – Residual Herbicide Weed counts 3rd July
Figure 4 : Block A Weed count assessments 2x1m Bed 3rd July
No phytoxicity was observed for any residual treatments (treatments 1-13) although a marginally lower crop height was observed within Forza and Innovator within treatment 12 and 13 which contained higher levels of active metribuzin. 20 40 60 80 100 120 Untreated Trt 2 Trt 3 Trt 4 Trt 5 Trt 6 Trt 7 Trt 8 Trt 9 Trt 10 Standard Trt 12 Trt 13 Trt 14 Trt 15 Trt 16 Weed Number per m2 Runch Groundsel S.Nettle Fat hen 10 20 30 40 50 60 70 80 90 100 Untreated Trt 2 Trt 3 Trt 4 Trt 5 Trt 6 Trt 7 Trt 8 Trt 9 Trt 10 Standard Trt 12 Trt 13 Trt 14 Trt 15 Trt 16 Weed Number per m2 Runch Groundsel S.Nettle Fat hen
SLIDE 19
Observations – Contact Herbicide Phytotoxicity At an average 15cm crop height, 20th June, a post emergence contact herbicide application was applied to Strip 14, 15 and 16. These treatments were assessed for levels of phytotoxicity – leaf yellowing/chlorosis 10 days after application – see Figure 5 Variety Phytotoxicity Score (0 none – 9 severe) – post emergence treatments assessed 30th June
Treatment 14 200g/ha Shotput Treatment 15 500g/ha shotput Treatment 16 200g/ha Shotput + 30g/ha Titus+ 200ml NI Wetter Maris Piper
2 6 4
Performer
1 4 3
Eurostar
2 5 2
Lanorma
1 2 2
Challenger Shepody
2 4 3
Maris Peer
2 5 4
Leontine
3 1
Royal
2 1
Soraya
1 2
Rooster
1 2
Jelly
1 2 1
Markies
1 1
Melody
2 4 4
Innovator
4 7 5
Russet Burbank
1 2 2
Daisy
1 3 2
Forza
4 8 6
Marfona Nectar
1 4 3
Brooke
1
Vales sovereign
1
Saxon
Figure 5 : Phytoxoicity Score – Post emergence applications
SLIDE 20 Discussion An untreated area, Figure 7 & 8, allowed an assessment of weed species present on the site, these were dominated by small nettle and groundsel with a lower level of runch and fat hen. Weed species also present at very low levels include cranesbill, fools parsley, field pansy and black bindweed. It was considered only the weed species present at higher levels allow a comparison of efficacy from the various treatments within this demonstration. The below compares residual performance
- nly excluding post emergence treatments 14,15 & 16.
Figure 7 : Untreated area 3rd June Figure 8 : Untreated area 31st August
SLIDE 21 Assessments - Groundsel The observed total weed count of groundsel from observations on 15th June and 3rd July, Figure 8 reveals variation between treatments
Figure 8 : Groundsel counts Total 4m2
Best Performance
Artist (metribuzin 225g/kg, flufenacet 240g/kg) 1.2 kg/ha + Stomp Aqua (pendimethalin 455g/l) 2 l/ha (Figure 9 A)
Shotput (metribuzin 70%) 600g/ha Praxim (metobromuron 500g/l) 3l/ha + Artist (metribuzin 225g/kg, flufenacet 240g/kg) 1kg/ha
Shotput (metribuzin 70%) 600g/ha (irrigation applied within 24 hrs)
Worst Performance
Stomp Aqua (pendimethalin 455g/l) 2.8 l/ha (Figure 9 B)
VCS 1717 (new a.i.) 2.5 l/ha
flufenecet 600g/ha Figure 9 A & B : Trt 7 and Trt 7 3rd July
The results indicate the level of metribuzin applied has the largest influence on the residual control
- f groundsel within this demonstration. Clomozone also provided good control of groundsel.
Assessments - S.Nettle
2 4 6 8 10 12 Untreated Trt 2 Trt 3 Trt 4 Trt 5 Trt 6 Trt 7 Trt 8 Trt 9 Trt 10 Standard Trt 12 Trt 13 Trt 14 Trt 15 Trt 16 Weed Number per m2
Groundsel
SLIDE 22 The observed total weed count of s.nettle from observations on 15th June and 3rd July, Figure 10 reveals variation between treatments
Figure 10 : S.Nettle counts Total 4m2
Best Performance
Praxim (metobromuron 500g/l) 2.5l/ha + Stomp Aqua(pendimethalin 455g/l) 2 l/ha + Shotput (metribuzin70%) 200g/ha (Figure 11A)
Praxim (metobromuron 500g/l) 2.5l/ha + Defy (prosulfocarb 800 g/l) 3l/ha + Shotput (metribuzin70%) 200g/ha
Stomp Aqua (pendimethalin 455g/l) 2 l/ha + Shotput (metribuzin70%) 400g/ha
Worst Performance
Gamit 25EC (clomazone xx g/l) (Figure 10B)
flufenecet 600g/ha
Stomp Aqua (pendimethalin 455g/l) 2.8 l/ha Figure 10 A & B : Trt 8 and Trt 5 Block A 3rd July
The results indicate the application of combination of actives including pendimethalin, metobromuron and metribuzin have a large influence on the residual control of S.nettle Assessments – Fat Hen
10 20 30 40 50 60 70 80 90 100 Untreated Trt 2 Trt 3 Trt 4 Trt 5 Trt 6 Trt 7 Trt 8 Trt 9 Trt 10 Standard Trt 12 Trt 13 Trt 14 Trt 15 Trt 16 Weed Number per m2
S.Nettle
SLIDE 23 The observed total weed count of fat hen from observations across the whole strip on 31st August, Figure 12
Figure 11 : Fat Hen counts – complete strip
Best Performance
Artist (metribuzin 225g/kg, flufenacet 240g/kg) 1.2 kg/ha + Stomp Aqua (pendimethalin 455g/l) 2 l/ha (Figure 12A)
VCS 1717 (new a.i.) 2.5 l/ha
Praxim (metobromuron 500g/l) 2.5l/ha + Stomp Aqua(pendimethalin 455g/l) 2 l/ha + Shotput (metribuzin70%) 200g/ha
Stomp Aqua (pendimethalin 455g/l) 2 l/ha + Shotput (metribuzin70%) 400g/ha
Standard Linuron (linuron 500g/l) 1.2l/ha + Stomp Aqua(pendimethalin 455g/l) 2 l/ha + Shotput (metribuzin70%) 200g/ha
Shotput (metribuzin 70%) 600g/ha
Worst Performance
Gamit 25EC (clomazone xx g/l) (Figure 12B)
flufenecet 600g/ha Figure 12 A & B : Trt 2 and Trt 6 3rd July 5 10 15 20 25 30 1 2 3 4 5 6 7 8 9 10 11 12 13 14 15 16 Weed Number per strip
Fat Hen
SLIDE 24 The results indicate metribuzin is likely to have the greatest influence on control although initial assessment of the new active coded VCS 1717 indicate good control on this site. Assessments - Runch
Figure 13 : Runch counts– complete strip
Best Performance
VCS 1717 (new a.i.) 2.5 l/ha(Figure 14A)
Praxim (metobromuron 500g/l) 2.5l/ha + Stomp Aqua(pendimethalin 455g/l) 2 l/ha + Shotput (metribuzin70%) 200g/ha
Stomp Aqua (pendimethalin 455g/l) 2 l/ha + Shotput (metribuzin70%) 400g/ha
Worst Performance
Stomp Aqua (pendimethalin 455g/l) 2.8 l/ha
Gamit 25EC (clomazone xx g/l) 200ml/ha
flufenecet 600g/ha Figure 14 A & B : Trt 2 and Trt 3 3rd July 2 4 6 8 10 12 14 16 18 20 Untreated Trt 2 Trt 3 Trt 4 Trt 5 Trt 6 Trt 7 Trt 8 Trt 9 Trt 10 Standard Trt 12 Trt 13 Trt 14 Trt 15 Trt 16 Weed Number per strip
Runch
SLIDE 25 The results indicate good control of Runch by many of the combination treatments. Runch is susceptible to metribuzin pre-emergence and results indicated good control with all treatments containing metribuzin. Initial assessment of the new active coded VCS 1717 also indicated good control on this site. Assessments – Post Emergence Herbicide Varietal Sensitivity The application of post emergence herbicides caused varying levels of scorch on this
- demonstration. The effects of Shotput (metribuzin) were varietal and rate dependant, treatment
14, Shotput 200g/ha (metribuzin 70%w/w) and treatment 15 Shotput 500g/ha (metribuzin 70%w/w). The effects of Titus (rimsulfuron), treatment 16 when applied in addition with Shoptput 200g/ha(metribuzin) were quite distinct across all varieties with a mottling pattern. However in addition to the leaf mottling a leaf scorch was obsevered which was varietal dependant, similar to the levels observed within treatment 14 Overall the levels of scorch due to post emergence metribuzin were lower than would have been anticipated on susceptible varieties within this demonstration.
Figure 15 Innovator Figure 16 Eurostar Figure 17 Markies Figure 18 Challenger
Treatment 15 Shotput 500g/ha (metribuzin 70%)
SLIDE 26 Conclusions – Residual Herbicides The weed spectrum on this site was more limited than expected with only low levels of B.Bindweed and Mayweed observed allowing no comparison of treatment performance with respect to these problematic weeds. High levels of Groundsel and S.nettle and moderate levels of Fat Hen and Runch were observed allowing a comparison of the treatments with regard to control of these weeds. The applications of individual a.i.’s allowed assessment of the strengths and weakness of the a.i. within this demonstration, Figure 20, with respect to the individual weeds present however it should be noted this was a non replicated demonstration and these are trends observed. Validation
- f these observations would require replicated trials within multiple sites and ideally more than one
season.
Active Ingredient Weeds metribuzin Metobromuron pendimethalin clomazone VCS 1717 Flufenacet S.nettle 2 m.susceptibl e m.susceptible susceptible
susceptible L.susceptible
susceptible L.susceptible susceptible
susceptible m.susceptible* m.susceptible
- susceptible
- Figure 19 : Comparison of A.I. performance
A commercially acceptable performance was observed with treatments 7 (metribuzin, flufenacet and pendimethalin) ,8 (metobromuron, prosulfocarb and metribuzin),9 (metobromuron, pendimethalin and metribuzin),10 (metribuzin and pendimethalin),11STD Linuron, pendimethalin and metribuzin) ,12(metribuzin) ,13(metribuzin). However the rates of metribuzin within treatments 7,10,12 and 13 (400-600g/ha 70% metribuzin) would be considered too high for some
- f the varieties within the demonstration for this soil type. Therefore the best broad variety
combinations observed from this demonstration, on this soil type are treatment 8 (metobromuron, prosulfocarb and metribuzin) and 9 (metobromuron, pendimethalin and metribuzin). Figure 19. The inclusion of three active substances also provides a broader control over a larger weed spectrum .
Figure 19 :A:Treatment 8 B: Treatment 9
SLIDE 27 However treatment 8 and 9 were expensive options, Figure 1, £66/ha and £71/ha respectively. If the variety was tolerant of metribuzin, treatment 10 (metribuzin and pendimethalin), £26/ha, would be the most cost effective broad spectrum control. Conclusions – Contact Herbicides The phytotoxicity and veinal leaf yellowing due to the post emergence metribuzin on this demonstration was less than expected on varieties previously trialled. However a comparison of effects on varieties within treatment 15 (Shotput 500g/ha metribuzin 70%w/w) enables a grouping
- f varieties in sensitivity bands, Figure 20
Figure 20 : Sensitivity to metribuzin post emergence
It should be noted all the above observations and assessments for both residual and contact treatments have been assessed from a demonstration block and replication of the treatments over a number of sites would be required to validate the trends observed.
Acknowledgements
VCS Potatoes Ltd would like to thank Elveden Farms, VCS (UK) Ltd and AHDB Potatoes for their assistance with this trial. G.Tomalin VCS Potatoes Ltd 29th December 2017
Tollerant Low Sensitivity Moderate Sensitivity High Sensivity V.Sovereign Royal M.piper Forza Brooke Daisy Leontine Innovator Marfona Lanorma Eurostar M.Peer Saxon R.Burbank Melody Rooster Jelly Nectar Challenger Performer Soraya Shepody Markies
SLIDE 28
VCS Potatoes Limited 2 Burnt Cottages, Badingham road, Framlingham, Suffolk IP13 9HX Tel: 07768 030003 email: graham@vcsagronomy.com
SPOT Farm East (Elveden) 2018– Residual and Post- emergence Contact Herbicide Demonstration Report
Background The urea based selective residual herbicide active linuron has been the major residual herbicide applied to the potato crop of the UK on loamy and sandy loam soil types for over 30 years. This active provides cost effective, crop safe control of many weeds observed on these soil types including S.nettle, Fat Hen, B.Bindweed and Mayweeds. The approval for Linuron application ceased on 3rd June 2018. This demonstration was the third in a sequence of trials to look at options following the loss of this active. Aims This demonstration aimed to assess the efficacy and crop safety of alternative residual herbicides and residual herbicide mixtures avoiding the use of linuron. Following the revocation date for Linuron, two of the remaining actives are varietal dependant in their phyto-toxicity characteristics – metribuzin, clomazone. The demonstration also assessed the crop safety of the alternative herbicides with regard to twenty six popular varieties grown in the UK. In addition when the crop was 15cm height a post emergence herbicide was applied to 3 plots.
SLIDE 29 Site Details The demonstration site – Common Heath 4 was a loamy sand. The complete trial was planted on 25th April. The seed size of the different varieties varied from 35x45mm, 45x55mm and 55x60mm. All the seed was treated with Monceren DS (pencycuron) @ 1kg/T at planting. Region West Suffolk Field Name Common Heath 4 Soil type Loamy sand Fertiliser Applications Soil Information Soil Index Available Nutrients from FYM application kg/ha Base Fertiliser Applied kg/ha Top Dressing Applied kg/ha Nitrogen 4 100 120 Phosphate 3 61 50 Potash 1 174 270 Magnesium 1 30 70 pH 7.8 Varieties Category Varieties
Processing Varieties
- R. Burbank, Royal, Performer, Challenger, Shepody, Innovator, Forza
Prepack Varieties
Lanorma, Soraya, Jelly, Marfona, Nectar, Melody, Sensation, Red Fantasy, Georgina
Crisping Varieties
Brooke, VR808
Salad Varieties
Maris Peer, Leontine, Gwenne, Angelique, Iodea, Gemson, Bambino
Ware Varieties
Maris Piper, Rooster Application details Date
Planting Date
25th April
Application date – Pre emergence Residual Herbicides
13th May
Application Date – Contact Herbicides
11th June
Weed count 1
14th June
Post emergence Assessment
20th June
SLIDE 30
Treatment List Trt No. Water Volume Herbicide Application 1. 13th May pre emergence Herbicide Application 2. 11th June @ 15cm
crop height
Residual Cost (not including
Contact)£/ha
1 Untreated £0 2 200 l/ha Praxim 2.5 l/ha + Stomp Aqua 1.8 l/ha + Shotput 200g/ha + Retro 3l/ha + NI Wetter £66 3 200 l/ha Praxim 2.5 l/ha + Defy 3l/ha + Shotput 200g/ha + Retro 3l/ha + NI Wetter £71 4 200 l/ha Praxim 4l/ha Retro 3l/ha + NI Wetter £72 5 200 l/ha VCS 1717 2.5 l/ha(aclonifen) + Retro 3l/ha + NI Wetter TBC 6 200 l/ha Defy 3 l/ha + Retro 3l/ha + NI Wetter TBC 7 200 l/ha VCS 1818 (2 actives) + Retro 3l/ha + NI Wetter TBC 8 200 l/ha Shotput 1000g/ha + Retro 3l/ha + NI Wetter £23 9 200 l/ha Stomp Aqua 1.8 l/ha + Shotput 400g + Retro 3l/ha + NI Wetter £26 10 200 l/ha Artist 1.2 kg/ha + Stomp Aqua 1.8l/ha + Retro 3l/ha + NI Wetter £45 11 200 l/ha VCS 1717 2.5 l/ha(aclonifen) + Stomp Aqua 1.8 l/ha + Shotput 200g/ha + Retro 3l/ha + NI Wetter TBC 12 200 l/ha VCS 1717 2.5 l/ha(aclonifen) + Defy 3l/ha + Shotput 200g/ha + Retro 3l/ha + NI Wetter TBC 13 200 l/ha VCS 1717 2.5 l/ha(aclonifen) + Shotput 400g/ha + Retro 3l/ha + NI Wetter TBC 14 200 l/ha VCS 1919 (3 actives) + Retro 3l/ha + NI Wetter TBC 15 200 l/ha STANDARD Praxim 2.5l/ha + Stomp Aqua 1.8 l/ha + Shotput 200g + Retro 3l/ha + NI Wetter Shotput 200g/ha £66 + £5 16 200 l/ha STANDARD Praxim 2.5l/ha + Stomp Aqua 1.8 l/ha + Shotput 200g + Retro 3l/ha + NI Wetter Shotput 500g/ha £66 + £12 17 200 l/ha STANDARD Praxim 2.5l/ha + Stomp Aqua 2 l/ha + Shotput 200g + Retro 3l/ha + NI Wetter Titus 30g/ha + Shotput 200g/ha + NI Wetter £66 + £20 18 200 l/ha STANDARD Praxim 2.5l/ha + Stomp Aqua 2 l/ha + Shotput 200g + Retro 3l/ha + NI Wetter Basagran 1.1 kg/ha £66 + TBC
Figure 1: Treatments and Costing
Note: diquat 3l/ha + NI Wetter 200ml/ha co-applied with all residual applications
SLIDE 31 Demonstration Plan
Figure 2 : Demonstration Plan
Row 1 Row 2 Row 3 Row 4 Row 5 Row 6 Row 7 Row 8 Row 9 Row 10 Row 11 Row 12 Row 13 Row 14 Row 15 Row 16 Row 17 Row 18 Row 19 Row 20 Row 21 Row 22 Row 23 Row 24 Row 25 Row 26 Row 27 Row 28
Gwenne Angelique Bambino Gemson Leontine Maris Peer Iodea Georgina Brooke VR 808 Innovator Forza Challenger Russet Royal Performer Rooster Lanorma Melody Jelly Red Fantasy Soraya Nectar M.piper TBC Shepody Blank Blank
2.0 m 543 544 545 546 547 548 549 550 551 552 553 554 555 556 557 558 559 560 561 562 563 564 565 566 567 568 1.5 m 2.0 m 517 518 519 520 521 522 523 524 525 526 527 528 529 530 531 532 533 534 535 536 537 538 539 540 541 542 1.5 m 2.0 m 491 492 493 494 495 496 497 498 499 500 501 502 503 504 505 506 507 508 509 510 511 512 513 514 515 516 1.5 m 2.0 m 465 466 467 468 469 470 471 472 473 474 475 476 477 478 479 480 481 482 483 484 485 486 487 488 489 490 1.5 m 2.0 m 439 440 441 442 443 444 445 446 447 448 449 450 451 452 453 454 455 456 457 458 459 460 461 462 463 464 1.5 m 2.0 m 413 414 415 416 417 418 419 420 421 422 423 424 425 426 427 428 429 430 431 432 433 434 435 436 437 438 1.5 m 2.0 m 387 388 389 390 391 392 393 394 395 396 397 398 399 400 401 402 403 404 405 406 407 408 409 410 411 412 1.5 m 2.0 m 361 362 363 364 365 366 367 368 369 370 371 372 373 374 375 376 377 378 379 380 381 382 383 384 385 386 1.5 m 2.0 m 335 336 337 338 339 340 341 342 343 344 345 346 347 348 349 350 351 352 353 354 355 356 357 358 359 360 1.5 m 2.0 m 309 310 311 312 313 314 315 316 317 318 319 320 321 322 323 324 325 326 327 328 329 330 331 332 333 334 1.5 m 2.0 m 283 284 285 286 287 288 289 290 291 292 293 294 295 296 297 298 299 300 301 302 303 304 305 306 307 308 1.5 m 2.0 m 257 258 259 260 261 262 263 264 265 266 267 268 269 270 271 272 273 274 275 276 277 278 279 280 281 282 1.5 m 2.0 m 231 232 233 234 235 236 237 238 239 240 241 242 243 244 245 246 247 248 249 250 251 252 253 254 255 256 1.5 m 2.0 m 205 206 207 208 209 210 211 212 213 214 215 216 217 218 219 220 221 222 223 224 225 226 227 228 229 230 1.5 m 2.0 m 179 180 181 182 183 184 185 186 187 188 189 190 191 192 193 194 195 196 197 198 199 200 201 202 203 204 1.5 m 2.0 m 153 154 155 156 157 158 159 160 161 162 163 164 165 166 167 168 169 170 171 172 173 174 175 176 177 178 1.5 m 2.0 m 127 128 129 130 131 132 133 134 135 136 137 138 139 140 141 142 143 144 145 146 147 148 149 150 151 152 2.0 m 101 102 103 104 105 106 107 108 109 110 111 112 113 114 115 116 117 118 119 120 121 122 123 124 125 126 2 m 1 Bed 1 Bed 1 Bed 1 Bed 1 Bed 1 Bed 1 Bed 1 Bed 1 Bed 1 Bed 1 Bed 1 Bed 1 Bed 1 Bed (tramline) BLOCK A : Residual applications only BLOCK B : Residual applications fb contact applications post emergence Trt 1 - Untreated Trt 2 - Praxim 2.5 l/ha + Stomp Aqua 1.8 l/ha + Shotput 200 g/ha Trt 3 - Praxim 2.5 l/ha + Defy 3.0 l/ha + Shotput 200 g/ha Trt 4 - Praxim 4.0 l/ha Trt 5 - VCS 1717 2.5 l/ha Trt 6 - Defy 3 l/ha Trt 7 - VCS 1818 ( 2 Actives) Trt 8 - Shotput 1 kg/ha Trt 9 - Stomp Aqua 1.8 l/ha + Shotput 400 g/ha Trt 10 - Artist 1.2 kg/ha + Stomp Aqua 1.8 l/ha Trt 11 - VCS 1717 2 l/ha + Stomp Aqua 1.8 l/ha + Shotput 200 g/ha Trt 12 - VCS 1717 2 l/ha + Defy 3.0 l/ha + Shotput 200 g/ha Trt 13 - VCS 1717 2.5 l/ha + Shotput 400 g/ha Trt 14 - VCS 1919 ( 3 actives) fb App 2 Titus 30 g/ha + Shotput 200 g/ha + NI Wetter Trt 18 - Praxim 2.5 l/ha + Stomp Aqua 2.0 l/ha + Shotput 200 g/ha fb App 2 Basagran 1.1 kg/ha Trt 15- Praxim 2.5 l/ha + Stomp Aqua 2.0 l/ha + Shotput 200 g/ha fb App 2 Shotput 200 g/ha Trt 16 - Paxim 2.5 l/ha + Stomp Aqua 2.0 l/ha + Shotput 200 g/ha fb App 2 Shotput 500 g/ha Trt 17 - Praxim 2.5 l/ha + Stomp Aqua 2.0 l/ha + Shotput 200 g/ha
SLIDE 32 Observations - Residual Herbicide Weed counts 14th June
Figure 3 : Weed count – Groundsel assessments 2x1m Bed 14th June Figure 4 : Block A Weed count assessments 2x1m Bed 14th June
Weed counts, figure 3 and 4, were undertaken on 14th June. The only weed which was observed with significant numbers was Groundsel, Figure 3. No phytoxicity was observed for any residual
- nly treatments (treatments 1-14).
10 20 30 40 50 60 Untreated Trt 2 Trt 3 Trt 4 Trt 5 Trt 6 Trt 7 Trt 8 Trt 9 Trt 10 Trt 11 Trt 12 Trt 13 Trt 14 Trt 15 Trt 16 Trt 17 Trt 18 Weed Number 2x1m Bed 1 2 3 4 5 6 7 8 Untreated Trt 2 Trt 3 Trt 4 Trt 5 Trt 6 Trt 7 Trt 8 Trt 9 Trt 10 Trt 11 Trt 12 Trt 13 Trt 14 Trt 15 Trt 16 Trt 17 Trt 18 Weed number 2x1m Bed Chickweed Volunteer Cereal S.Nettle AMG Flixweed Knottgrass B.Bindweed
SLIDE 33
Observations – Contact Herbicide Phytotoxicity At an average 15cm crop height, 11th June, a post emergence contact herbicide application was applied to Strip 15, 16, 17 and 18. These treatments were assessed for levels of phytotoxicity – leaf yellowing/chlorosis 10 days after application – see Figure 5 Variety Phytotoxicity Score (0 none – 9 severe) – post emergence treatments assessed 22nd June
Treatment 15 200g/ha Shotput Treatment 16 500g/ha shotput Treatment 17 200g/ha Shotput + 30g/ha Titus+ 200ml NI Wetter Treatment 18 1.1 Kg/ha Basagran Gwenne
Leaf mottle observed
1
Angelique
Leaf mottle observed
Bambino
Leaf mottle observed
Gemson
Leaf mottle observed
Leontine
1 1
Leaf mottle observed
2
Iodea
Leaf mottle observed
3
Maris Peer
Leaf mottle observed
Georgina
Leaf mottle observed
Brooke
Leaf mottle observed
VR 808
2 3
Leaf mottle observed
Innovator
2 6
Leaf mottle observed
1
Forza
1 5
Leaf mottle observed
1
Challenger
Leaf mottle observed
Russet Burbank
Leaf mottle observed
2
Royal
Leaf mottle observed
Performer
1 2
Leaf mottle observed
Rooster
Leaf mottle observed
Lanorma
Leaf mottle observed
Melody
1 3
Leaf mottle observed
1
Jelly
Leaf mottle observed
Red Fantasy
3
Leaf mottle observed
1
Soraya
Leaf mottle observed
Nectar
1 1
Leaf mottle observed
M.piper
Leaf mottle observed
Sensation
1
Leaf mottle observed
Shepody
2
Leaf mottle observed Figure 5 : Phytotoxicity Score – Post emergence applications
SLIDE 34
Discussion An untreated area, Figure 7, allowed an assessment of weed species present on the site, these were dominated by groundsel with a very low level of alternative weeds. Weed species also present at very low levels include annual meadow grass, volunteer cereals, flixweed, s.nettle, knotgrass, chickweed and black bindweed. Figure 8-20 are photos of each residual treatment at 5th July.
Figure 7 : Untreated area 5th July
SLIDE 35
Figure 8 : Treatment 2 area 5th July Figure 9 : Treatment 3 area 5th July
SLIDE 36
Figure 10 : Treatment 4 area 5th July Figure 11 : Treatment 5 area 5th July
SLIDE 37
Figure 12 : Treatment 6 area 5th July Figure 13 : Treatment 7 area 5th July
SLIDE 38
Figure 14: Treatment 8 area 5th July Figure 15: Treatment 9 area 5th July
SLIDE 39
Figure 16: Treatment 10 area 5th July Figure 17: Treatment 11 area 5th July
SLIDE 40
Figure 18: Treatment 12 area 5th July Figure 19: Treatment 13 area 5th July
SLIDE 41 Figure 20: Treatment 13 area 5th July
It was considered only groundsel was at sufficient levels to allow a comparison of efficacy from the various treatments within this demonstration. Assessments - Groundsel The observed total weed count of groundsel from observations on, Figure 21 reveals variation between treatments
Figure 21 : Groundsel counts Total 4m2
10 20 30 40 50 60 Untreated Trt 2 Trt 3 Trt 4 Trt 5 Trt 6 Trt 7 Trt 8 Trt 9 Trt 10 Trt 11 Trt 12 Trt 13 Trt 14 Weed Number 2 x 1m Bed
Groundsel
SLIDE 42 Best Performance
Trt 8 Shotput (metribuzin 70%) 1.0 kg/ha Trt 12 Shotput (metribuzin 70%) 200g/ha + VCS 1717(aclonifen) 2.5 l/ha + Defy (prosulfocarb) 3l/ha Trt 7 VCS 1818 (2 actives including clomazone)
Worst Performance
Trt 2 Praxim(metabromuron) 2.5 l/ha + Stomp aqua(pendimethalin 455g/l) 1.8 l/ha + Shotput (metribuzin 70%) 200g/ha Trt 5 VCS 1717 (aclonifen) 2.5 l/ha Trt 4 Praxim (metabromuron) 4 l/ha
Assessments – Post Emergence Herbicide Varietal Sensitivity The application of post emergence herbicides caused varying levels of scorch on this
- demonstration. The effects of Shotput (metribuzin) were varietal and rate dependant, treatment
15, Shotput 200g/ha (metribuzin 70%w/w) and treatment 16 Shotput 500g/ha (metribuzin 70%w/w), see figure 22-25. The effects of Basagran 1.1kg/ha treatment 18 were also varietal dependant, see figure 26-27. Overall the levels of scorch due to post emergence metribuzin were lower than would have been anticipated on susceptible varieties within this demonstration.
Figure 22 Innovator Figure 23 Melody Figure 24 VR 808 Figure 25 Performer
Treatment 16 Shotput 500g/ha (metribuzin 70%)
SLIDE 43 Figure 26 Leontine/M.peer Figure 27 Challenger/R.burbank
Treatment 18 Basagran 1100g/ha (bentazone)
Conclusions – Residual Herbicides The weed spectrum on this site 2018 was very limited with rapid crop growth quickly suppressing weed growth. Groundsel was the only weed species with sufficient numbers to compare treatments. The applications of individual a.i. allowed assessment of the strengths and weakness of the a.i. within this demonstration, Figure 28, with respect to groundsel, however it should be noted this was a non replicated demonstration and these are trends observed. Validation of these
- bservations would require replicated trials within multiple sites and ideally more than one season.
Active Ingredient Weeds metribuzin Metobromuron pendimethalin clomazone VCS 1717 Flufenacet Groundsel susceptible L.susceptible
L.susceptible
- Figure 28 : Comparison of A.I. performance
All residual applications provided a commercially acceptable performance of weed control on this site, in this season.
SLIDE 44 Conclusions – Contact Herbicides Metribuzin The phytotoxicity and veinal leaf yellowing due to the post emergence metribuzin on this demonstration was less than expected on varieties previously assessed. However a comparison of effects on varieties within treatment 16 (Shotput 500g/ha metribuzin 70%w/w) enables a grouping
- f varieties in sensitivity bands, Figure 29
Figure 29 : Sensitivity to metribuzin post emergence * Limited trial data
Basagran The phytotoxicity/leaf yellowing due to post emergence bentazone was quickly out grown on this site due to high ambient temperatures. A comparison of effects on varieties within treatment 18 (Basagran 1.1kg/ha, bentazone) enables a grouping of varieties within sensitivity bands, Figure 30
Figure 30 : Sensitivity to bentazone post emergence * Limited trial data
It should be noted all the above observations and assessments for both residual and contact treatments have been assessed from a demonstration block and replication of the treatments over a number of sites would be required to validate the trends observed. Tolerant Low Sensitivity Moderate Sensitivity High Sensivity
V.Sovereign* Royal M.piper Forza Brooke* Daisy* Leontine Innovator Marfona Lanorma* Eurostar M.Peer Saxon R.Burbank Melody VR808 Challenger* Jelly Nectar Markies Angelique Performer Bambino Gwenne Gemson* Shepody Rooster Georgina* Soraya Iodea*
Tolerant to Very Low Sensitivity Label'Ok to treat' Moderate Sensitivity - Label 'Bordeline' High Sensivity - Label ' Do not treat' M.peer Innovator* R.Burbank M.piper Rooster* Shepody Melody* Gwenne* Angelique* Leontine* Bambino* Forza* Jelly* Gemson* Challenger* Iodea* Soraya* Brooke* Sensation* Royal* Red Fantasy* Lanorma* VR808* Nectar* Performer* Mozart* Georgina*
SLIDE 45
Acknowledgements
VCS Potatoes Ltd would like to thank Elveden Farms, VCS (UK) Ltd and AHDB Potatoes for their assistance with this demonstration. G.Tomalin VCS Potatoes Ltd 30th March 2019