
Speed perception by drivers as dependent on urban street design
Victoria Gitelman Fany Pesahov Roby Carmel Transportation Research Institute Technion – Israel Institute of Technology, Haifa, Israel 32nd ICTCT Conference in Warsaw, Poland - October 24 & 25, 2019
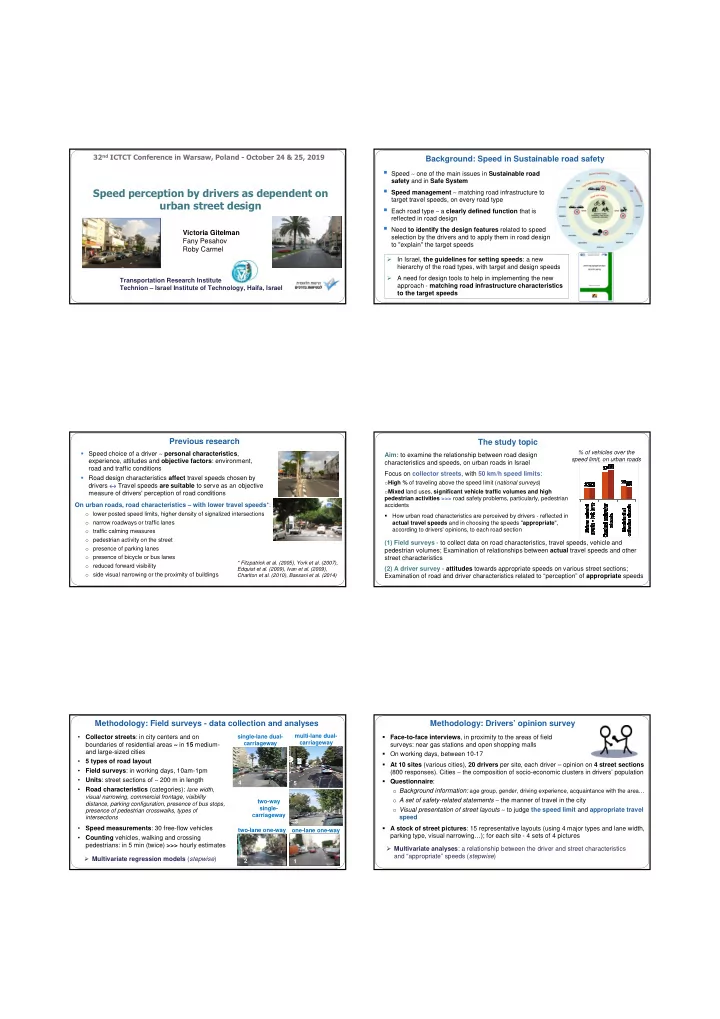
Background: Speed in Sustainable road safety
Speed ∼ one of the main issues in Sustainable road
safety and in Safe System
Speed management ∼ matching road infrastructure to
target travel speeds, on every road type
Each road type ∼ a clearly defined function that is
reflected in road design
Need to identify the design features related to speed
selection by the drivers and to apply them in road design to "explain" the target speeds
- In Israel, the guidelines for setting speeds: a new
hierarchy of the road types, with target and design speeds
- A need for design tools to help in implementing the new
approach - matching road infrastructure characteristics to the target speeds Speed choice of a driver ∼ personal characteristics, experience, attitudes and objective factors: environment, road and traffic conditions Road design characteristics affect travel speeds chosen by drivers ↔ Travel speeds are suitable to serve as an objective measure of drivers' perception of road conditions
Previous research
On urban roads, road characteristics ∼ with lower travel speeds*:
- lower posted speed limits, higher density of signalized intersections
- narrow roadways or traffic lanes
- traffic calming measures
- pedestrian activity on the street
- presence of parking lanes
- presence of bicycle or bus lanes
- reduced forward visibility
- side visual narrowing or the proximity of buildings
* Fitzpatrick et al. (2005), York et al. (2007), Edquist et al. (2009), Ivan et al. (2009), Charlton et al. (2010), Bassani et al. (2014)
The study topic
% of vehicles over the speed limit, on urban roads Aim: to examine the relationship between road design characteristics and speeds, on urban roads in Israel Focus on collector streets, with 50 km/h speed limits:
- High % of traveling above the speed limit (national surveys)
- Mixed land uses, significant vehicle traffic volumes and high
pedestrian activities >>> road safety problems, particularly, pedestrian accidents (1) Field surveys - to collect data on road characteristics, travel speeds, vehicle and pedestrian volumes; Examination of relationships between actual travel speeds and other street characteristics (2) A driver survey - attitudes towards appropriate speeds on various street sections; Examination of road and driver characteristics related to “perception” of appropriate speeds
- How urban road characteristics are perceived by drivers - reflected in
actual travel speeds and in choosing the speeds "appropriate", according to drivers' opinions, to each road section
Methodology: Field surveys - data collection and analyses
- Collector streets: in city centers and on
boundaries of residential areas ∼ in 15 medium- and large-sized cities
- 5 types of road layout
- Field surveys: in working days, 10am-1pm
- Units: street sections of ∼ 200 m in length
- Road characteristics (categories): lane width,
visual narrowing, commercial frontage, visibility distance, parking configuration, presence of bus stops, presence of pedestrian crosswalks, types of intersections
- Speed measurements: 30 free-flow vehicles
- Counting vehicles, walking and crossing
pedestrians: in 5 min (twice) >>> hourly estimates Multivariate regression models (stepwise) single-lane dual- carriageway multi-lane dual- carriageway two-way single- carriageway two-lane one-way
- ne-lane one-way
1 2 3 4 5
Methodology: Drivers’ opinion survey
At 10 sites (various cities), 20 drivers per site, each driver – opinion on 4 street sections (800 responses). Cities ∼ the composition of socio-economic clusters in drivers’ population Questionnaire:
- Background information: age group, gender, driving experience, acquaintance with the area…
- A set of safety-related statements ∼ the manner of travel in the city
- Visual presentation of street layouts ∼ to judge the speed limit and appropriate travel
speed A stock of street pictures: 15 representative layouts (using 4 major types and lane width, parking type, visual narrowing…); for each site - 4 sets of 4 pictures Multivariate analyses: a relationship between the driver and street characteristics and “appropriate” speeds (stepwise) Face-to-face interviews, in proximity to the areas of field surveys: near gas stations and open shopping malls On working days, between 10-17