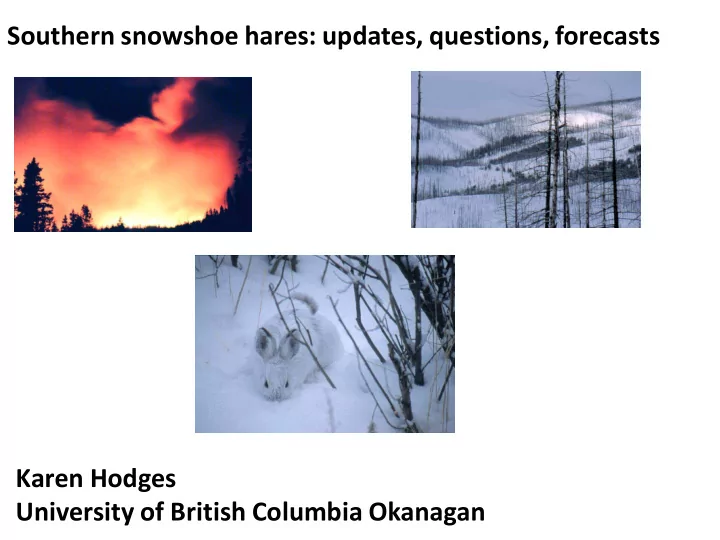
SLIDE 1
Southern snowshoe hares: updates, questions, forecasts Karen Hodges University of British Columbia Okanagan
SLIDE 2
MAJOR POINT #1. Northern hare cycles are highly variable. (iffy synchrony, variable peak heights and amplitudes)
Krebs et al. 2013. Canadian Journal of Zoology 91:562-572
SLIDE 3
Is the cycle gradient, as told by textbooks, true?
years hares Boreal forest hares years Montane forest
SLIDE 4
Major stand types in NW Montana
“mature” “unthinned” “thinned”
SLIDE 5 10 20 30 40 50 60 70
Hares / 20 ha in 2002
Yellowstone NW Montana
MAJOR POINT #3A. Region matters enormously to hare abundances.
we trapped 13 sites:
SLIDE 6
Western hare densities differ substantially across landscapes (mostly live-trapping data)
NW Montana (2001-12): 0.72 ± 0.12 hares/ha Mills & Hodges unpublished Oregon (2001-2): 0.25-0.42 Washington (2003-4) 0.82 ± 0.07 Abele et al. 2013 Lewis et al. 2009 Wyoming (YNP) (2002-7): 0.20 Wyoming (2006-8): 0.48-1.69 Hodges et al. 2009 Berg et al. 2012 (pellets) Idaho (1998-2000): 0.09 Colorado (2002-3): 0.154 Wirsing et al. 2002 Zahratka & Shenk 2008
SLIDE 7
Maine 1.00-1.85 Maine (summary of others): 0-1.8 Homyack et al. 2007 Simons-Legaard et al. 2013 Voyageurs NP, Minnesota (2006-9): ~0.35 hares/ha Moen et al. 2012 northeast Minnesota (2003-6): ~0.64 hares/ha McCann and Moen 2011
Hare densities vary with landscapes further east, too (mostly pellet data)
SLIDE 8 Landscape attributes matter to stand quality for hares
In North Cascades, WA: hare density increased with:
- -stand saplings
- -stand medium trees
- -“moist forest” within 300 m
and decreased with
- -“open” forest within 300 m.
Variables within 300 m more explanatory than variables within 600 m
Lewis et al. 2009. Journal of Mammalogy 92:561-567.
SLIDE 9
MAJOR POINT #3B. Hare population dynamics also differ with region (cyclicity, synchrony, amplitude, and peak densities vary!)
0.0 0.5 1.0 1.5 2.0
2001 2002 2003 2004 2005 2006 2007 2008 2009
hares per hectare
Montana Yukon Yellowstone
SLIDE 10
What happens to hares when habitats are disturbed?
SLIDE 11
0.0 0.5 1.0 1.5 2.0 2.5 3.0 3.5 control thinned control thinned hares per hectare ~1100 m elevation ~1500 m elevation
Forestry actions that reduce stand structure reduce hare abundances. Here, experimental precommercial thinning in Montana caused declines.
MAJOR POINT #4A.
Hodges and Mills, unpublished
SLIDE 12
In Quebec, hare densities increase with years since commercial thinning
Bois et al. 2012 . Canadian Journal of Forest Research 42:123-133 1 m radius circles
SLIDE 13
Quebec, Hodson et al. 2011. Canadian Journal of Zoology 89: 908-920
And with years post-fire or post-harvest
SLIDE 14
In Quebec, forest age & history matter to snowshoe hares
Allard-Duchene et al 2014. Forest Ecology and Management 313:17-25
SLIDE 15
MAJOR POINT #4B. Fires destroy habitats short-term.
has hares in 2002-2003 2003 ‘East’ fire has no hares in 2004-2007 not good hare habitat in 2011
YELLOWSTONE
SLIDE 16
MAJOR POINT #4C. Hares re-use burned sites as soon as habitat enables them to do so.
We sampled 1988 burns in Yellowstone from 2002-2007
SLIDE 17 0.0 0.3 0.6 0.9 1.2 1.5 10 20 30 40 50 saplings per 2 m radius circle pellets
Yellowstone stands regenerating after the 1988 fires. . .
2 4 6 8 10 12 <0.1 0.25 - 1 >1 pellets per plot number of sites
has no hares has hares support few hares, with most sites having none are most likely to have hares if they have high sapling densities Hodges, Mills, and Murphy. 2009. J. Mammalogy 90:870-878
SLIDE 18
Cheng, Hodges & Mills 2015. Fire Ecology 11:119-136.
In Glacier National Park, we found similar patterns
data 2005-2007
SLIDE 19
High mean—and high variance— in hare density in 1988 burns (17-19 yr post-fire)
n=87 n=23 n=4 Cheng, Hodges & Mills. 2015. Fire Ecology 11:119-136
SLIDE 20
Stands regenerating after 1988 fires: Glacier beats Yellowstone
Cheng, Hodges & Mills 2015, Hodges et al. 2009
Yellowstone Glacier (2002-2007) (2005-2007) sites with 47% 80% hare pellets maximum density 1.3 2.4 (hares/ha) average density 0.14 0.39 average density 0.27 0.49 for sites with hares
SLIDE 21
Speculation #1: How many hares do we need to keep lynx around?
Problem 1: Tally Lake sites in western MT: regionally high hares, but full of bobcats instead of lynx Problem 2: Yellowstone has very low hare abundances, but has lynx Problem 3: Spatial scales for “regional density” poorly articulated (lynx home range sizes vary, presumably partly in response to hare densities) Problem 4: Lynx diets vary; we know less about red squirrel abundances than hare abundances
SLIDE 22 Speculation #2: Future distribution and abundance of snowshoe hares
- 1. Forest loss (harvest, thinning, fire), will mean fewer hares
at least for a few years. Unknown impacts of salvage logging post-fire.
- 2. We know more about hares and trees than about
hares and shrubs. But understory cover and browse are very important to hares.
- 3. We don’t know much about hares and winter snows
(a few regional models, not much local or specific)
With very high confidence: if we completely lose southern boreal / montane forest, hare numbers will decline in those areas.
SLIDE 23
Speculation #3: Some hare lineages may be at risk themselves (or may respond differently to upcoming challenges) High genetic structure in southern range
Cheng et al. 2014. Molecular Ecology 23:2929-2942.
High gene flow across boreal range
SLIDE 24 Speculation #4: Impacts of climate change on snowshoe hares?
- 1. Fires, insect outbreaks, changed forest regeneration
- -habitat structure matters to hares, so changed
habitats means changed distribution / abundance
- 2. Coat colour issues?
- -mismatch coat / forest floor may increase mortality
- -molt cue is daylength
- 2. Changing forest community?
- -Unclear impacts on hares of different
predator communities
- -impacts of predation by bobcats, fisher, etc. are
poorly known compared to raptors, lynx, coyote
SLIDE 25 Frontiers in snowshoe hare research
- 1. Explaining regional variation in dynamics, peak abundance
- 2. Predicting post-fire re-colonization and density
- 3. Predicting responses to climate change (fires, winter snow pack,
forest conditions: molt timing, physiology, demography)
- 4. Physiology – demography links (predation stress and reproduction)