
SLIDE 1
South African Childrens Reading Literacy Achievement PIRLS and - - PowerPoint PPT Presentation
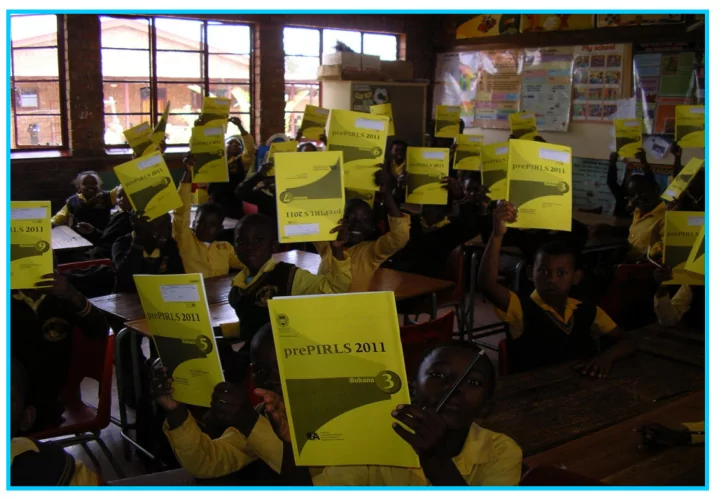
South African Childrens Reading Literacy Achievement PIRLS and prePIRLS 2011 Summary of the key results Prof. Sarah Howie and Dr Surette van Staden National Research Coordinators Centre for Evaluation and Assessment, University of Pretoria
50 100 150 200 250 300 350 400 450 500 550
PIRLS 2006 Grade 5 Results by Test Language
AIM GOAL use of a wide range of text types within each purpose for reading, with an equal proportion of material assessing each reading purpose to create an authentic reading experience PIRLS prePIRLS 800 words per text 400 words per text shorter, easier vocabulary and simpler syntax
Afrikaans English isiNdebele isiXhosa isiZulu Sepedi Sesotho Setswana siSwati Tshivenda Xitsonga
Afrikaans English
PIRLS 2011 Participating Countries
Main study participants PIRLS benchmarking participants
Australia Italy Alberta, Canada Austria Kuwait Ontario, Canada Azerbaijan Lithuania Quebec, Canada Belgium (French) Malta Maltese-Malta Botswana Morocco English/Afrikaans –South Africa Bulgaria Netherlands Andalusia, Spain Canada New Zealand Abu Dhabi, UAE Chinese Taipei Northern Ireland Dubai, UAE Colombia Norway Florida, USA Croatia Oman Czech Republic Poland
prePIRLS participants
Denmark Portugal Botswana England Qatar Colombia Finland Romania South Africa France Russian Federation Georgia Saudi Arabia
Note: Bahrain, Egypt, Kuwait, Libya and Qatar were countries that withdrew from prePIRLS 2011
Germany Singapore Honduras Slovak Republic
Grade 6 participants
Hong Kong SAR Slovenia Hungary Spain Indonesia Sweden Iran, Islamic Rep of Trinidad and Tobago Ireland United Arab Emirates Israel United States
Study Grade Attained sample No of learners prePIRLS 4 341 15 744 PIRLS 5 92 3 515 Total 433 19 259
576 500 463 461 100 200 300 400 500 600 700 Colombia International Centre point Botswana South Africa Average scale score
500 461 446 475
100 200 300 400 500 600
Intenational Centre point South Africa Gr 4 Boys Gr 4 Girls
Average scale score
International Centre point
550 525 531 436 429 443 388 425 428 452 395 407
100 200 300 400 500 600 International Centre point
10 20 30 40 50 60 70 80 90 100 Afrikaans English isiNdebele isiXhosa isiZulu Sepedi Sesotho Setswana siSwati Tshivenda Xitsonga Percentage of Grade 4 Learners Gr 4 Same Gr 4 Different
590 449 458 511 365 100 200 300 400 500 600 700 Same Different
569 552 548 538 515 476 457 450 424 424 421 419 419
100 200 300 400 500 600
571 568 568 567 558 556 552 531 527 450 448 439 430 428 425 421 419 391 310
100 200 300 400 500 600
Test Language and Home Language Performance by Test Language 43% 58%
0% 10% 20% 30% 40% 50% 60% 70%
Same as Language of the Test Different from Language of the Test
Percentage of learners
500 421 427 431 397 418 523 389 100 200 300 400 500 600
421 427 419 403 416 398
50 100 150 200 250 300 350 400
South Africa Afrikaans English 2011 2006
29 71 Percentage of learners Not Attained Low
30 23 12 6
Low Intermediate High Advanced
22 35
78 65 48 36 21 16 7 5
Girl Boy Not reached Low International Benchmark Intermediate International Benchmark High International Benchmark Advanced International Benchmark
29 12 10 31 38 29 57 36 34 24 53 47 71 88 90 69 62 71 43 64 66 76 47 53
6 15 19 0.2 0.4 0.8 0.1 0.1 0.25
South Africa Afrikaans English isiNdebele isiXhosa isiZulu Sepedi Sesotho Setswana siSwati Tshivenda Xitsonga
Did not reach Low International benchmark Intemediate International Benchmark High International Benchmark Advanced International benchmark
5 43 39 45 95 57 61 55 80 34 33 34 44 14 11 15
8 4 2 5
International median South Africa Afrikaans English Did not reach Low International Benchmark Intemediate International Benchmark High International Benchmark Advanced International Benchmark
57% 66% 72% 100% 95% 99% 97% 99% 97% 34% 28% 38% 90% 80% 92% 87% 92% 87% 14% 4% 10% 48% 44% 63% 62% 63% 58% 4% 1% 7% 8% 18% 24% 19% 19%
SA Gr 5 Afr and Eng Indonesia Colombia Netherlands International Median Finland Singapore Russian Federation Northern Ireland
Low International Benchmark High International Benchmark Intermediate International Benchmark Advanced International Benchmark
38% 48% 62% 52% 38% 31% 14% 13% 5% 3%
Girls Boys Not attained Low International Benchmark Intermediate International Benchmark High International Benchmark Advanced International Benchmark
19 81 16 84 72 28 36 64 45 55 74 26 10 20 30 40 50 60 70 80 90 Not reached Low Not reached Low Not reached Low Not reached Low Not reached Low Not reached Low Urban Suburban Township Medium city
small town
Remote rural
47 43 53 57 36 34 17 14 5 4 2006 2011
Did not reach Low International benchmark Intemediate International Benchmark High International Benchmark Advanced International benchmark
530 531 448 516 441 428
100 200 300 400 500 600
Urban Suburban Township Medium size city Small town Remote rural
Grade 4 Score
102 pts
427 442 504 484 468 457
50 100 150 200 250 300 350 400 450 500 550 600 No Teacher Qualification Certificate in Education/Pre-Service Diploma 4-Year Diploma in Education Bachelors Degree Postgraduate Diploma Postgraduate In-Service Diploma or Certificate
prePIRLS 2011 Teacher Qualifications
Series1
Afrikaans 34 English 36 isiNdebele 47 isiXhosa 45 isiZulu 41 Sepedi 43 Sesotho 45 Setswana 43 siSwati 53 Tshivenda 44 Xitsonga 46
36 35 37 38 35 39 5 10 15 20 25 30 35 40 45 South Africa Afrikaans English
PIRLS Class Sizes
2011 2006
585 514 445 430 100 200 300 400 500 600 700 School Library 5000+ School Library 501-5000 School Library 500 Books or less No school Library
6 15 20
School library with more than 5 000 books School library with 500-5 000 books School library with 500 books or less No school library
652 484 448
100 200 300 400 500 600 700 Afrikaans English isiNdebele siSwati Tshivenda Xitsonga South Africa Many resources Some resources Few resources
467 518 463 505 433 486 100 200 300 400 500 600 South Africa International average Safe and orderly Somewhat safe and orderly Not safe and orderly 24 10 6 14 8 26 22 12 13 8 14 4 20 40 60 80 100 120 Afrikaans English isiNdebele isiXhosa isiZulu Sepedi Sesotho Setswana siSwati Tshivenda Xitsonga South Africa International average Safe and orderly Somewhat safe and orderly Not safe and orderly
17 47 28 33
55 20
50 100
South Africa International average Almost never Sometimes Often
511 483 447 523 513 489
100 200 300 400 500 600
Almost never Sometimes Often South Africa International average