
SLIDE 1
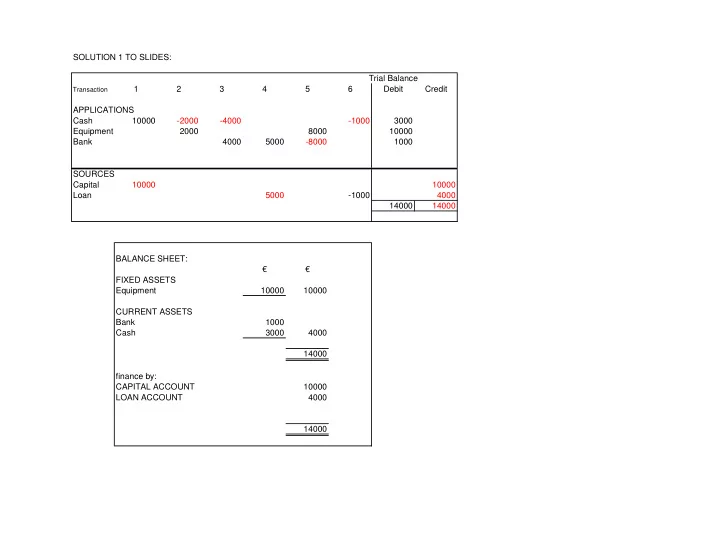
SOLUTION 1 TO SLIDES: Trial Balance
Transaction
1 2 3 4 5 6 Debit Credit APPLICATIONS Cash 10000
- 2000
- 4000
- 1000
3000 Equipment 2000 8000 10000 Bank 4000 5000
- 8000
1000 SOURCES Capital 10000 10000 Loan 5000
- 1000
4000 14000 14000 BALANCE SHEET: € € FIXED ASSETS Equipment 10000 10000 CURRENT ASSETS Bank 1000 Cash 3000 4000 14000 finance by: CAPITAL ACCOUNT 10000 LOAN ACCOUNT 4000 14000