
SLIDE 1
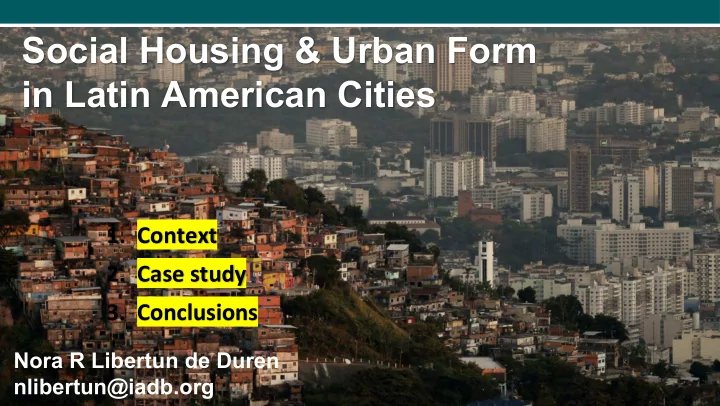
Social Housing & Urban Form in Latin American Cities
- 1. Context
- 2. Case study
- 3. Conclusions
Nora R Libertun de Duren nlibertun@iadb.org
Social Housing & Urban Form in Latin American Cities 1. Context - - PowerPoint PPT Presentation
Social Housing & Urban Form in Latin American Cities 1. Context 2. Case study 3. Conclusions Nora R Libertun de Duren nlibertun@iadb.org Context 1960s 2010s Rural to Urban Migration Urban to Rural Expansion Source: Sebastiao
Nora R Libertun de Duren nlibertun@iadb.org
Source: Sebastiao Salgado_ Amazonas Pictures
Source: Own elaboration based on UN Habitat 2014, State of Cities; and Angel et al, 2011. The Dynamics of Global Urban Expansion
Urban Area
Urban Population
1960 2010 2025
City Rural uses Shantytowns Gated … Social Housing Remaining area
0% 10% 20% 30% 40% 50% 60% 70% 80% 90% 100% 1960 1970 1980 1990 2000 2010 32%
Urban residents live in informal neighborhoods
55 million
Lack access to adequate housing
57%
Of urban residents work in the informal economy
Inequality
Latin-American cities are the most unequal in terms of coverage & quality of services
High levels of informality Uneven access to urban services
Bogotá. Fuente: Caracol Radio
Qualitative Quantitative (
Qualitative Quantitative Qualitative
DEFICIT 7% Quantitative 93% Qualitative (10m urban households SUBSIDIES 6% repairs to existing units 94% credit for new units (+55million usd)
annual target: 750k social housing units
25% housing units were built after 2000
22 Km average distance to downtown
87% of units were built
11% of units were built on
the 1st ring
Peripheral vs Central Social housing Development
+Interviews to developers +review policy instruments 26,600 US$ 37,000 US$
Peripheral vs Central ECONOMIES OF SCALE
Average company size
500+ vs 70 employees
Portfolio All vs only social housing
Peripheral vs Central COST STRUCTURE: land + infrastructure
land infrastructure
Peripheral vs Central COST STRUCTURE: Economies of scale
More negotiation power
Small vs big municipalities…
National programs determine
Funding structure Architectural standards
Municipal governments determine
Land use
Central and Peripheral Social Housing Developers
Have similar cost structures Gain is based on
National Policies
Mismatch between need and demand (subsides for new vs improved)
Subnational policies
Push social housing to periphery Lack metro coordination leads to expanded urban footprint
Suggestions
PROACTIVE
ü Match subsidies to demand ü Support rental housing & improvement programs ü Increase urban densities & metropolitan planning ü Limit maximum social housing complex size
Suggestions
REACTIVE
ü Support jobs in peripheries ü Improve transport connections ü Develop public spaces of quality ü Facilitate legal processes ü Improve environmental performance
Nora R Libertun de Duren nlibertun@iadb.org