
SLIDE 1
Snake Valley Groundwater Studies
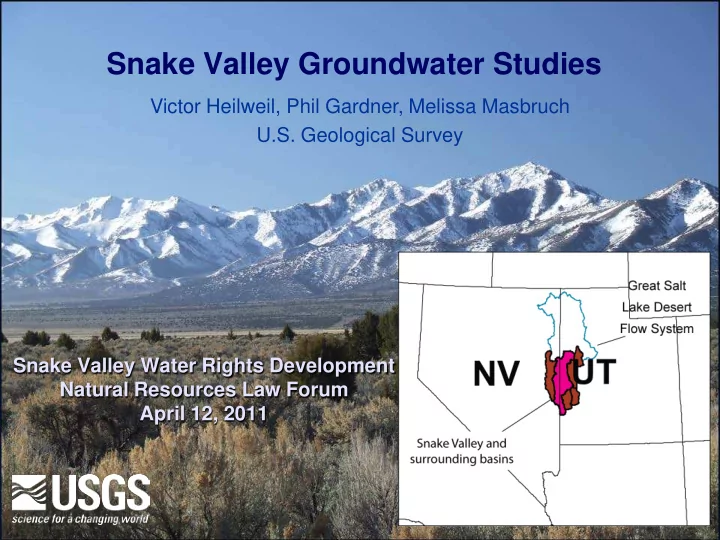
Victor Heilweil, Phil Gardner, Melissa Masbruch U.S. Geological Survey Snake Valley Water Rights Development Natural Resources Law Forum April 12, 2011
Snake Valley Groundwater Studies Victor Heilweil, Phil Gardner, - - PowerPoint PPT Presentation
Snake Valley Groundwater Studies Victor Heilweil, Phil Gardner, Melissa Masbruch U.S. Geological Survey Snake Valley Water Rights Development Natural Resources Law Forum April 12, 2011 Conceptual model of groundwater budget Well pumping
Victor Heilweil, Phil Gardner, Melissa Masbruch U.S. Geological Survey Snake Valley Water Rights Development Natural Resources Law Forum April 12, 2011
Evapotranspiration Springs
Well pumping
Snake Valley Fish Springs Flat
Precipitation Sub-surface inflow ? Evapo- transpiration Wells and springs Sub-surface
(Hood and Rush, 1965) (Gates and Kruer, 1981) (Welch and others, eds, 2007) (Harrill and Prudic, 1988)
recharge and discharge range from 100,000 to 160,000 acre-ft/yr
(Heilweil and Brooks, eds, 2011)
*pre-development and includes spring discharge
40,000 80,000 120,000 160,000 200,000 240,000 Tech Pub 14 (1965) Tech Pub 71 (1981) RASA (1988) BARCAS (2007) GBCAAS (2011) Total Recharge Total Discharge
Acre-ft / year
?
discharge estimate)
20,000 40,000 60,000 80,000 100,000 120,000 1… 1… 1… 1… 1… 1… 1… 1… 1… 1… 1… 1… 1… 1… 1… 1… 1… 1… 1… 2… 2… Withdrawal, acre-ft/yr
Beryl-Enterprise pumping and water levels 40 60 80 100 120 140 160 1946 1956 1966 1976 1986 1996 2006 Subsidence cracks
(Photo courtesy of Bill Lund, UGS)
Water level below land surface (feet)
20,000 40,000 60,000 80,000 100,000 120,000 140,000 160,000 180,000 Withdrawal, acre-ft/yr
Salt Lake Valley pumping and water levels
10 20 30 40 50 60 70 80 90 100
Water level below land surface (feet)
Impacts of additional pumping in Snake Valley will likely fall somewhere between these two end members
Monitoring well drilling Discharge measurements (Twin Springs)
Utah Geological Survey
http://geology.utah.gov/databases/gro undwater
B’ B A A’
Hugh Hurlow, West Desert Monitoring Program Utah Geological Survey hughhurlow@utah.gov 801-537-3385 Phil Gardner, Snake Valley Project Chief US Geological Survey pgardner@usgs.gov 801-908-5041 http://ut.water.usgs.gov/projects/snake/ http://geology.utah.gov/databases/groundwater
Study Recharge from Precipitation Subsurface Inflow Total Recharge Evapotran spiration Wells/ Springs Sub- surface Outflow Total Discharge Tech Pub 14 (1965) 100,000 4,000 104,000 95,000 7,000 10,000 112,000 Tech Pub 71 (1981) 102,000 4,000 106,000 64,000 18,000 42,000 124,000 RASA (1988) 100,000 4,000 104,000
111,000 49,000 160,000 132,000*
161,000 GBCAAS (2011) 160,000 ± 80,000 ?? 160,000± 80,000 100,000 ± 25,000 30,000 ±7,500 ?? 130,000± 30,000
* pre-development and includes spring discharge