Simultaneous measurement of the ELMs at both high and low field - - PowerPoint PPT Presentation

simultaneous measurement of the elms at both high and low
SMART_READER_LITE
LIVE PREVIEW

Simultaneous measurement of the ELMs at both high and low field - - PowerPoint PPT Presentation

Simultaneous measurement of the ELMs at both high and low field sides and ELM dynamics in crash-free period in KSTAR Hyeo eon K. Pa Park UN UNIST, Uls Ulsan, Korea at 25 th IAEA FEC Conference Oct. 12 -18 2014, St. Petersburg, ELMs at


slide-1
SLIDE 1

Simultaneous measurement of the ELMs at both high and low field sides and ELM dynamics in crash-free period in KSTAR

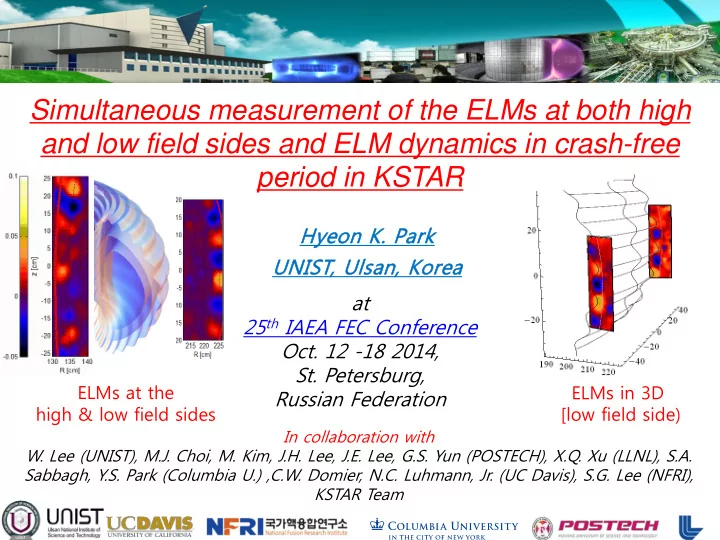
ELMs at the high & low field sides ELMs in 3D [low field side)

at 25th IAEA FEC Conference

  • Oct. 12 -18 2014,
  • St. Petersburg,

Russian Federation Hyeo eon K. Pa Park UN UNIST, Uls Ulsan, Korea

In collaboration with

  • W. Lee (UNIST), M.J. Choi, M. Kim, J.H. Lee, J.E. Lee, G.S. Yun (POSTECH), X.Q. Xu (LLNL), S.A.

Sabbagh, Y.S. Park (Columbia U.) ,C.W. Domier, N.C. Luhmann, Jr. (UC Davis), S.G. Lee (NFRI), KSTAR Team

slide-2
SLIDE 2

Outline

  • KSTAR 2D/3D ECE Imaging and MIR system

 2D validation of the physics in modeling  predictive capability of MHD and transport physics modeling

  • Images of the ELMs in H-mode plasma

 Growth -> Saturation -> Crash  Validate the measured ELMs with synthetic images

  • ELMs at High field side

 Discrepancies with the current understanding

  • ELM dynamics during the crash free period

 Underlying dynamics of suppression/mitigation of the ELMs?

slide-3
SLIDE 3

G H

Combined with 2D MIR

KSTAR 2D/3D Imaging systems

EX/P8-15, Choi EX/P8-12, G. Yun EX/P8-13, W. Lee

Frequency [kHz] Poloidal wavenumber [cm

  • 1]

#8969 t=7.043442-7.197158s (ref.ch. ECEIG1404) 50 100 150 200 250

  • 1.5
  • 1
  • 0.5

0.5 1 1.5

2D Density fluctuation T

e fluctuation

(k vs. ω) m/n=2/1 mode Modified sawtooth

Cold bubble Leads to disruption

2D T

e

fluctuation (30-50 kHz)

at 23rd FEC Daejeon Korea

slide-4
SLIDE 4

HFS

Low Field Side (LFS) High Field Side (HFS)

LFS

KSTAR ECEI viewing windows (B0=2.0 T)

HFS O-mode

Poloidal view of the KSTAR plasma Characteristic frequencies of the electron cyclotron emission

Measurement with O-mode polarization is verified for Sawtooth crash

  • J. Lee_JINST_(2011)
slide-5
SLIDE 5

Dynamics of a single ELM in KSTAR H-mode plasmas

G.S. Yun et al., PRL 107 (2011)

1 2 3 100 µs 200 µs 0 µs

LCFS

(1) Initial growth

4

400 µs

LCFS

(2) Saturation

slide-6
SLIDE 6

BOUT++ Simulation* Synthetic Image (ideal) Synthetic Image with system noise Measured image

  • M. Kim et al., NF 54 (2014)
  • Observed structure = a faithful representation of ELM filaments
  • Phantom image outside the separatrix due to ECE downshift from inside

(well known); masked by finite system noise and scattered emission

  • We ignore ECE signals contaminated by the downshifts

phantom

Instrument Function

Validation of the ELM structure

δT/<T <T>

Major radius (cm)

slide-7
SLIDE 7

ECEI-1 ECEI-2

Poloidal spacing Toroidal spacing Pitch angle

ECEI-1 (LFS) ECEI-2 (GFS)

ch_10 ch_15

Relationship between toroidal (n), poloidal (m) mode numbers & pitch angle (α∗)

J.H. Lee, RSI, 85 (2014) J.E. Lee, 9th APFA conference (2013) Range of toroidal mode numbers 4 < n < 16

slide-8
SLIDE 8

R [cm] z [cm] 140 160 180 200 220 240

  • 100
  • 50

50 100

0.5 AU

  • 1.6
  • 1.4

V Frequency [kHz] 10 20

  • 1.85
  • 1.8

V Frequency [kHz] Time [s] 5.5 5.52 5.54 5.56 5.58 5.6 10 20

TV image with EFIT

ECEI ~5.569s LFS i image

ECEILFS, 0902 ECEIHFS, 0306

LFS-0902 X HFS-0306 X

ECEI ~5.569s HFS i ima mage

KSTAR #9380

Simultaneous measurement of the ELMs at both HFS and LFS (2013)

slide-9
SLIDE 9

LFS edge ge

ECEI

HFS S edge ge

ECEI

KSTAR #9380 ECEI ~5.569s LFS i ima mage

Rotation direction and mode strength

KSTAR #9380 ECEI ~5.569s HFS i image ge

  • Rotation direction – Asymmetries in toroidal and/or poloidal velocity
  • Comparable mode strength at HFS and LFS – No shear flow damping at HFS ?
slide-10
SLIDE 10

ECEI ~6.840s HFS i ima mage ECEI ~6.840s LFS i image Refractive index

Z [m] R [m]

Mode spacing based on Ballooning mode

  • In and out pressure asymmetry ? unlikely
  • The structure of ELM filaments at the HFS is

not consistent with the ballooning mode structure.

ne(max)~3x10¹⁹/m3

  • Refraction effect - the actual mode

spacing in HFS should be larger than the observed one.

slide-11
SLIDE 11

Correlation image for #9379 t=6.839249-6.843688s (ref.ch. GD 22-5) R [cm] Z [cm] 130 135 140

  • 25
  • 20
  • 15
  • 10
  • 5

5 10 15 20 25 Z [cm]

  • 20
  • 15
  • 10
  • 5

5 10 15 20 Correlation image for #9379 t=6.839249-6.843688s (ref.ch. LD 9-2) R [cm] 220 215 225

  • 0.8
  • 0.6
  • 0.4
  • 0.2

0.2 0.4 0.6 0.8

LFS 225 13 0.13 HFS 132 10 0.09

140 160 180 200 220 0.05 0.1 0.15 0.2 R [cm]

Pitch (mid-plane)

  • ELM structure + strong shear flow in HFS

edge -> streamer like role ?

HFS-2205 X LFS-0902 X

2-D correlation image of the HFS & LFS ELMs

slide-12
SLIDE 12

Burst process of the HFS & LFS ELMs (2013)

Time evolution of a single global ELM crash

slide-13
SLIDE 13

Time (s)

ne (m-2) rf (0.6 GHz)

n=1 MP

f (kHz)

A B C

ELMs & crashes in crash free period (2011)

dB/dt (T/s)

No large crash but

  • ccasional tiny crashes

B0=2T, Ip=600kA, T

e(0)~2.5

keV, <ne>~3×1013 cm-3 Wtot~250kJ 240kJ

change from n=10 to n=5 mode

ELM crash free period (No steady ELM)

No changes in background

C A B

Major radius R(cm)

15 10 5

  • 5
  • 10
  • 15

205 210 215 220 225 230 205 210 215 220 225 230

  • No steady ELMs
  • ELMs with tiny crashes

accompanied with rf bursts

G.S .S.Y .Yun, , PoP 19 ( (2012)

Time (sec)

slide-14
SLIDE 14

Dα ne (m-2) rf

(0.2 GHz)

f (kHz)

B0 = 1.8 T, Ip = 510 kA q95 ~ 4.5, PNBI = 2.7 MW Wtot: 220180 kJ

MP

Time (s)

dB/dt

(T/s)

A B C

ELMs & crashes in crash free period (2012)

  • rf signal (<200 MHz) is a good measure of ELM crash
  • Broad-band dB/dt signal is not from high-n mode crash (Note:

e: EX/1-5 Y. Jun)

  • Observation has been

consistent over 3 years

  • High-n  suppression or

High-n  low-n  suppression

  • Suppressed time consist of

Smaller bursts (bunching and single), brief moment without ELM, and persistent ELM with higher n without crash

slide-15
SLIDE 15

Bursting ELM period

Illustration of no burst and burst cases (2012)

Steady ELM period

Little change in magnetic signals !! rf signal is much better indicator

  • f the ELM crash
slide-16
SLIDE 16

Summary

  • Findings from the HFS ELMs

Mode number discrepancies – in/out asymmetry in pressure profile or Ballooning representation incorrect?? Large mode amplitude – high flow shear damping at the HFS?? Rotation direction – asymmetries in toroidal/poloidal velocities + others (e.g., Pfirsch Schluter flow)?? Crash proceeds first at LFS – Ballooning characteristics??

  • ELM dynamics during the “suppression” period

Change of the edge confinement  less free energy  higher n, higher frequency, smaller crashes (bunching and singles), persistent ELMs without crash and brief moment without ELMs :marginal free energy or intricate physics?? Broad spectra of dB/dt signals during ELM suppression period is not from the high-n mode burst