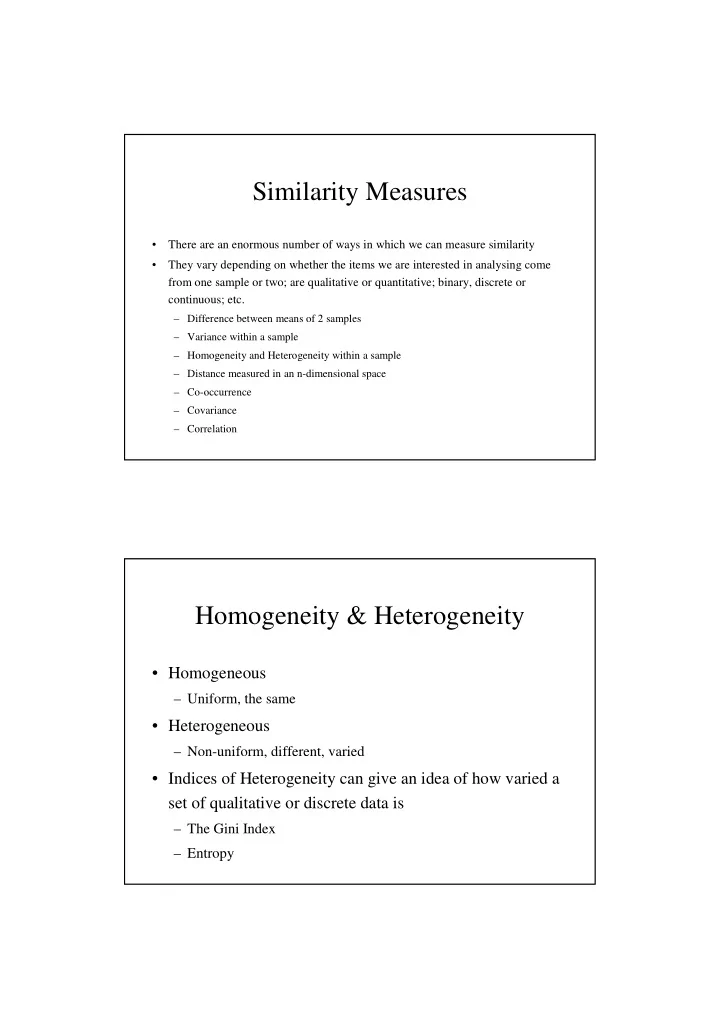
similarity measures
play

Similarity Measures There are an enormous number of ways in which - PDF document

Similarity Measures There are an enormous number of ways in which we can measure similarity They vary depending on whether the items we are interested in analysing come from one sample or two; are qualitative or quantitative; binary,


  1. Similarity Measures • There are an enormous number of ways in which we can measure similarity • They vary depending on whether the items we are interested in analysing come from one sample or two; are qualitative or quantitative; binary, discrete or continuous; etc. – Difference between means of 2 samples – Variance within a sample – Homogeneity and Heterogeneity within a sample – Distance measured in an n-dimensional space – Co-occurrence – Covariance – Correlation Homogeneity & Heterogeneity • Homogeneous – Uniform, the same • Heterogeneous – Non-uniform, different, varied • Indices of Heterogeneity can give an idea of how varied a set of qualitative or discrete data is – The Gini Index – Entropy

  2. The Gini Index • Suppose we have a characteristic or data field which can take values x 1 , …, x n • Further suppose that, amongst the sample we are interested in, the value x i has a relative frequency of p i , where 0 ≤ p i ≤ 1 and ∑ p i = 1 – Maximum homogeneity would occur when p i = 1 for just one i and 0 for all the others – Maximum heterogeneity would occur when p i = 1/n for all i • The Gini index of heterogeneity is defined as – G = 1 - ∑ p i 2 • This index would be zero at maximum homogeneity and have the value 1 - 1/n at maximum heterogeneity • We can normalise the index to range from 0 to 1 by – G’ = nG/(n-1) Entropy • An alternative index of heterogeneity which is used in many fields of study (including Machine Learning) is Entropy – E = - ∑ p i log p i • This index will also be 0 in the case of maximum homogeneity but will be log n in the case of maximum heterogeneity • We can normalise Entropy to range from 0 to 1 by – E’ = E/log n

  3. Distance Metrics • A distance metric provides a method for measuring how far apart two items are if they are plotted on a graph in which the axes represent certain characteristics of the items – Clearly the characteristics must have ordinality – I.e. the values which the characteristics take must be amenable to being placed in a meaningful order from smallest to largest – Quantitative data values which are continuous are most suitable – Discrete quantitative (including binary) values are normally OK – Qualitative values are rarely appropriate for a distance metric Euclidean Distance Metric • The Euclidean distance metric is the most popular • Suppose we have n characteristics each of which can take a range of numerical values • The Euclidean distance between two items, x and y , is given by – d(x, y) = √ [ ∑ (x i – y i ) 2 ] Where the summation is over all characteristics, i , from 1 to n and x i and y i are the values of characteristic i for x and y respectively • When n=2 this is the distance between two points in 2D space • For larger n we have n axes but apply the same principle

  4. Co-occurrence • When dealing with binary values a useful piece of information can be to know when two items both take the value 0 and/or 1 for a set of characteristics (data fields) and when they differ – 0 would normally indicate the absence, and 1 the presence, of some characteristic • Let P be the total number characteristics which the two items might possess – CP (co-presence) denotes the number of characteristics for which both items take the value 1 – CA (co-absence) denotes the number of characteristics for which both items take the value 0 – PA (presence-absence) denotes the number of characteristics for which the first item takes the value 1 when the second takes the value 0 – AP (absence-presence) denotes the number of characteristics for which the first item takes the value 0 when the second takes the value 1 Similarity Indices • A number of similarity indices have been developed which are based on the notion of co-occurrence, co-absence, etc. – Russel and Rao S xy = CP/P – Jacard S xy = CP/(CP + PA + AP) – Sokal and Michener S xy = (CP + CA)/P

  5. Covariance • The relationship between two quantitative characteristics, as manifested in a number of sample cases, can be investigated by examining the covariance of the two characteristics • This is sometimes known as the concordance of the two characteristics – If there is a tendency for one characteristic to have high values and low values at the same time as the other then they are said to be concordant – If the tendency is the opposite then the characteristics are said to be discordant ( )( ) N 1 ∑ = − − Cov ( X , Y ) x x y y i i N = 1 i Variance-Covariance Matrices • If we wish to investigate more than two characteristics then we can form a matrix of the covariances of all pairs of characteristics in which we are interested • The main diagonal of this matrix will be the covariance of each characteristic with itself – This is simply that characteristic’s variance (hence the name of the matrix) • For four characteristics the matrix would be composed as follows –   Var ( C ) Cov ( C , C ) Cov ( C , C ) Cov ( C , C ) 1 1 2 1 3 1 4     Cov ( C , C ) Var ( C ) Cov ( C , C ) Cov ( C , C ) 2 1 2 2 3 2 4   Cov ( C , C ) Cov ( C , C ) Var ( C ) Cov ( C , C )  1 3 2 3 3 4  3     Cov ( C , C ) Cov ( C , C ) Cov ( C , C ) Var ( C ) 4 1 4 2 4 3 4

  6. Correlation • Whilst the covariance of two characteristics is a useful exploratory indicator, it does not give a measure of how strongly the characteristics are related • The value of the covariance needs normalising in some way if we are to be able to use it to judge the degree to which two characteristics are related • We know that the maximum value that the covariance can take will be the product of the standard deviations of our two characteristics ( σ x σ y ) • We also know that the minimum value it can take will be the negative of this same quantity (- σ x σ y ) • We can therefore normalise the covariance by dividing it by the product of the standard deviations of the two characteristics to obtain their correlation Correlation Coefficient • The correlation coefficient for two characteristics is defined to be - ( , ) Cov X Y = r ( X , Y ) σ σ x y • The correlation coefficient will have a maximum value of 1, when a plot of the two characteristics across all of the data items forms a straight line with positive slope (they are proportional) • Similarly, it will have a minimum value of -1, when the plot forms a straight line with negative slope (they are inversely proportional) • A correlation coefficient of 0 means there is no relationship at all

  7. Correlation Matrices • As with the covariance, it is possible to form a matrix from all pair-wise combinations of correlation coefficients –   1 r ( C , C ) r ( C , C ) r ( C , C ) 1 2 1 3 1 4     r ( C , C ) 1 r ( C , C ) r ( C , C ) 2 1 2 3 2 4   r ( C , C ) r ( C , C ) 1 r ( C , C )   1 3 2 3 4 3     r ( C , C ) r ( C , C ) r ( C , C ) 1 4 1 4 2 4 3 • This provides a neat way of presenting the relationships between a set of characteristics that supports a comparative analysis Exercise • Consider 4 characteristics which can be measured for each item in a sample of 6 A B C D Item 1 6 1 5 2 Item 2 3 2 4 2 Item 3 5 3 4 3 Item 4 1 4 3 4 Item 5 4 5 3 5 Item 6 2 6 2 5 • Determine the pair-wise correlation coefficient matrix for the 4 characteristics and comment on the values

Download Presentation
Download Policy: The content available on the website is offered to you 'AS IS' for your personal information and use only. It cannot be commercialized, licensed, or distributed on other websites without prior consent from the author. To download a presentation, simply click this link. If you encounter any difficulties during the download process, it's possible that the publisher has removed the file from their server.

Recommend


More recommend