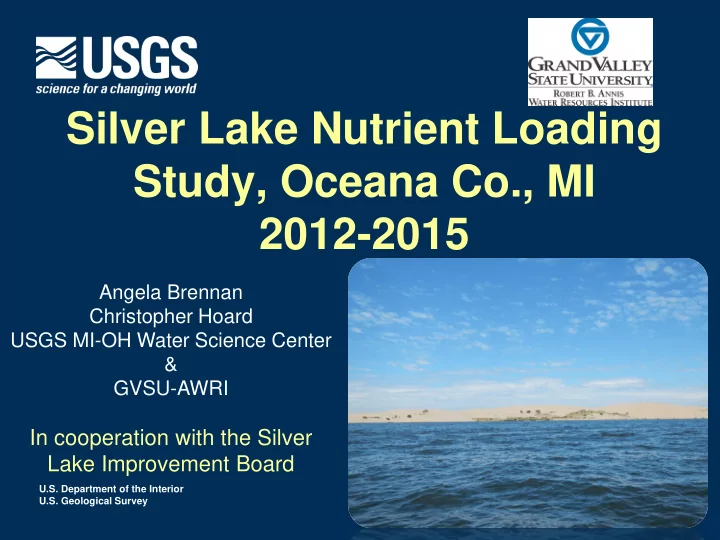
SLIDE 1 U.S. Department of the Interior U.S. Geological Survey
Silver Lake Nutrient Loading Study, Oceana Co., MI 2012-2015
Angela Brennan Christopher Hoard USGS MI-OH Water Science Center & GVSU-AWRI
In cooperation with the Silver Lake Improvement Board
SLIDE 2 Project Problem
published the “Silver Lake 2011 Water Quality Monitoring Report”
- Study results indicated Silver Lake appeared to
be undergoing more accelerated eutrophication and if the trend continued, that there would be more frequent and prolonged algal blooms, reduced transparency, and a decline in overall water quality.
SLIDE 3 Project Objectives
- Describe current water quality in the lake,
groundwater, tributaries, and atmosphere
- Quantify the water and nutrient budgets for Silver
Lake and estimate the contribution of septic systems
- Identify the nutrient(s) limiting algal growth in Silver
Lake
- Present model scenarios of future lake conditions in
response to changes in nutrient loading inputs
SLIDE 4
Silver Lake, Oceana County, MI
SLIDE 5 Approach
- Monitor surface water flow & establish a
water budget
- Water chemistry:
- Monitoring lake and stream chemistry 4 times per year for
2 years, plus 2-3 storm events (annually)
- 5 monitoring locations on lake
- Water temp, DO, Conductivity, pH
- Secchi disc transparency
- Chlorophyll-a, phytoplankton, N, P (surface & bottom)
SLIDE 6 Approach cont…
- Monitor groundwater influence:
- 4 wells, measure GW levels & nutrient
chemistry for 2 years (North, South, East, & West)
- Observe groundwater flow by installing
seepage meters
- Measure drainage tiles for N & P
(38 tiles)
SLIDE 7 Approach cont…
- Precipitation
- Wet (rain and snow) & dry (several days
following no precip) samples to determine atmospheric nutrient deposition (N and P)
- Nutrient inputs from lawn
runoff and waterfowl
- Estimated from previously published
literature values
SLIDE 8 Approach cont…
- Identify nutrient controlling
algal blooms (AWRI)
- Nutrient bioassay, algal ID
(cyanotoxins)
- Internal nutrient loading
estimates (AWRI), determine flux of P & N from sediments
treatments
SLIDE 9 Project results – Trophic Status
Trophic status of Silver Lake, Oceana County, Michigan, based
- n Carlson’s Trophic State Index. (TSI, trophic state
index; less than 40 represents oligotrophic conditions, 40-50 mesotrophic, greater than 50 represents eutrophic conditions).
SLIDE 10
Project results – Nutrient concentrations
SLIDE 11 Project results
loading is not a major source of P to Silver Lake
be co-limited by P and N
- Cyanotoxin levels are not an issue to date
SLIDE 12
Project Results – Nutrient Loading
SLIDE 13
adjustment scenarios of phosphorus and nitrogen to Silver Lake were processed using the BATHTUB model.
Predicting future lake conditions
SLIDE 14 USGS Scientific Investigations Report 2015-5158
Prepared in cooperation with the Silver Lake Improvement Board Angela K. Brennan, Christopher J. Hoard, Joseph W. Duris, Mary E. Ogdahl, and Alan D. Steinman https://pubs.er.usgs.gov/ publication/sir20155158
SLIDE 15
Thank you!
SLIDE 16 U.S. Department of the Interior U.S. Geological Survey
Silver Lake Nutrient Loading Study, Oceana Co., MI: 2012-2014
Recommendations
SLIDE 17
Both nitrogen and phosphorus co-limit algal growth Summary Point #1
SLIDE 18
Nutrient Bioassay: July 2013
SLIDE 19
Need to reduce only N or P to limit algal growth, but limiting both will reduce size and severity of algal blooms
Recommendation #1
SLIDE 20
The current algal blooms do not have concentrations of toxins
Summary Point #2
SLIDE 21
Silver Lake
Site Date Concentration (µg/L) 1 (surface) 2 (surface) 4/17/14 <0.05 <0.05 1 (surface) 2 (surface) 5/2/14 <0.10 <0.05
Microcystin Concentration
SLIDE 22
Blooms should be tested for cyanotoxins, but 2013- 2014 data indicate very low toxicity
Recommendation #2
SLIDE 23
Sources of N and P 1) are not always the same, and 2) differ over time
Summary Point #3
SLIDE 24
GW is largest contributor of P on annual basis (47%)
SLIDE 25 Hunter Creek is largest contributor
basis (56%)
SLIDE 26 P in the GW:
constant
in summer
SLIDE 27 N in the GW:
variable
in summer
SLIDE 28
P Control: Focus first on groundwater; second on Hunter Cr. N Control: Focus first on Hunter Creek; second on summer GW
Recommendation #3
SLIDE 29
Almost 1/3 of the P in groundwater is associated with septage Summary Point #4a (P)
SLIDE 31
Replace septic systems with sanitary sewers…
Recommendation #4a
SLIDE 32
Summary Point #4b (P)
Septic inputs vary around Silver Lake
SLIDE 33 Location
GW Septic
North Quadrant 12 6 South Quadrant 403 193 East Quadrant 15 7 West Quadrant 132 63 North Drain Tiles 68 33 Hunter Creek 385 86
TOTAL 630 388
Estimated TP Loading (lb/yr)
SLIDE 34
If funding is a limitation, prioritize regions with highest P loads and bioavailable P Recommendation #4b
SLIDE 35
Summary Point #5 (N)
Hunter Creek and summer groundwater main sources of N
SLIDE 36
SLIDE 37
Identify source of N to Hunter Creek
Recommendation #5