shmtools for shm and sensor diagnostics lug assembly
play

SHMTOOLS FOR SHM AND SENSOR DIAGNOSTICS: LUG ASSEMBLY APPLICATIONS - PDF document

18 TH INTERNATIONAL CONFERENCE ON COMPOSITE MATERIALS SHMTOOLS FOR SHM AND SENSOR DIAGNOSTICS: LUG ASSEMBLY APPLICATIONS H. Shin 1 , C. Yun 1 , G. Park 2, *, J. Lee 1 , C. Park 3 , S. Jun 3 , C.R. Farrar 2 1 Department of Aerospace


  1. 18 TH INTERNATIONAL CONFERENCE ON COMPOSITE MATERIALS “SHMTOOLS” FOR SHM AND SENSOR DIAGNOSTICS: LUG ASSEMBLY APPLICATIONS H. Shin 1 , C. Yun 1 , G. Park 2, *, J. Lee 1 , C. Park 3 , S. Jun 3 , C.R. Farrar 2 1 Department of Aerospace Engineering, Chonbuk National University, Jeonju, Korea, 2 The Engineering Institute, Los Alamos National Laboratory, Los Alamos, NM, USA 3 Agency for Defense Development, Daejun, Korea * Corresponding author (gpark@lanl.gov) Keywords : structural health monitoring, piezoelectric sensor, sensor diagnostics, SHM tools, Lug assembly types, values, and descriptions are displayed and 1 Introduction functions are easily connected together by dragging SHMTools is a free, open-source set of standardized output variables from one to the input variables of MATLAB software tools for Structural Health 
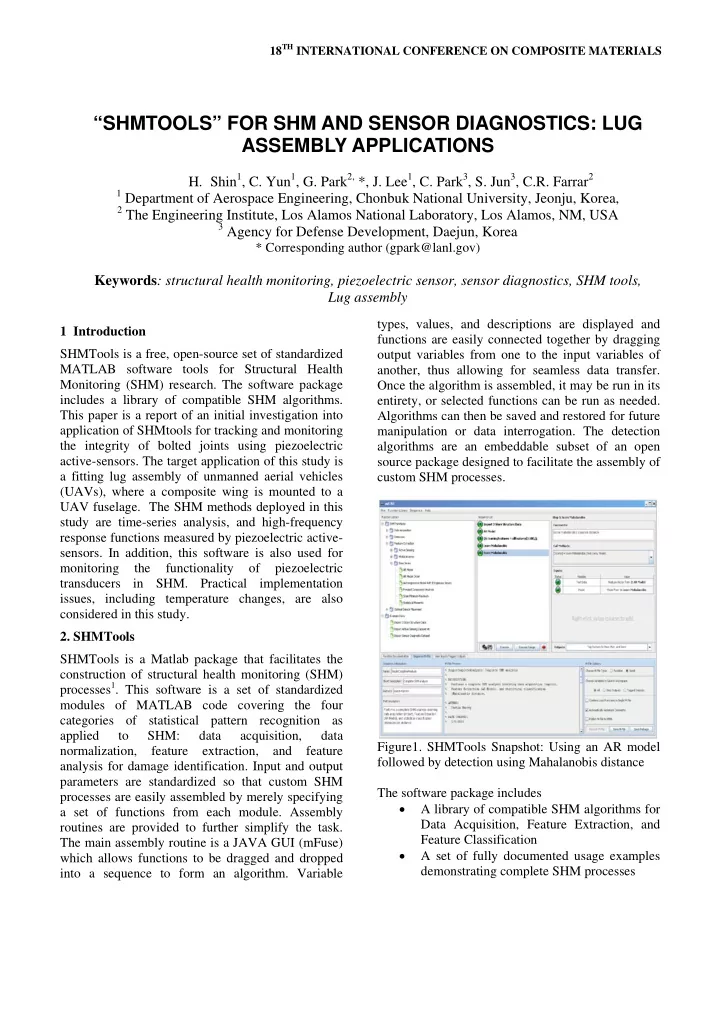
another, thus allowing for seamless data transfer. Monitoring (SHM) research. The software package Once the algorithm is assembled, it may be run in its includes a library of compatible SHM algorithms. entirety, or selected functions can be run as needed. This paper is a report of an initial investigation into Algorithms can then be saved and restored for future application of SHMtools for tracking and monitoring manipulation or data interrogation. The detection the integrity of bolted joints using piezoelectric algorithms are an embeddable subset of an open active-sensors. The target application of this study is source package designed to facilitate the assembly of a fitting lug assembly of unmanned aerial vehicles custom SHM processes. (UAVs), where a composite wing is mounted to a UAV fuselage. The SHM methods deployed in this study are time-series analysis, and high-frequency response functions measured by piezoelectric active- sensors. In addition, this software is also used for monitoring the functionality of piezoelectric transducers in SHM. Practical implementation issues, including temperature changes, are also considered in this study. 2. SHMTools SHMTools is a Matlab package that facilitates the construction of structural health monitoring (SHM) processes 1 . This software is a set of standardized modules of MATLAB code covering the four categories of statistical pattern recognition as applied to SHM: data acquisition, data Figure1. SHMTools Snapshot: Using an AR model normalization, feature extraction, and feature followed by detection using Mahalanobis distance analysis for damage identification. Input and output parameters are standardized so that custom SHM The software package includes processes are easily assembled by merely specifying • A library of compatible SHM algorithms for a set of functions from each module. Assembly Data Acquisition, Feature Extraction, and routines are provided to further simplify the task. Feature Classification The main assembly routine is a JAVA GUI (mFuse) • A set of fully documented usage examples which allows functions to be dragged and dropped demonstrating complete SHM processes into a sequence to form an algorithm. Variable

  2. • Additionally, time series predictive models, such as mFUSE: an interface for the graphical autoregressive model with exogenous inputs (ARX), assembly of custom SHM processes • can be used as a damage-sensitive feature extractor. Test structure data sets for benchmarking An ARX model is fit to the data to capture the SHM algorithms input/output relationship, which is intended to The SHMTools is the beginning of a larger effort to enhance the damage detection process by utilizing a collect, archive, and share various approaches to system 3 . piezoelectric active-sensing Both SHM and can be downloaded from http://institute. techniques are applied to a lug assembly. Without lanl.gov/ei/software-and-data/SHMTools/. In this any temperature changes, these methods could study, this software tool is used for SHM of a fitting clearly identify structural damage, which was lug assembly and sensor diagnostics in the presence simulated by loosening connection bolts of the lug of temperature variations. assembly 4 . In order to understand the effects of 3.Test structure: a UAV lug assembly temperature variations on the damage detection A lug joint is one of the most critical structural capability, different temperature conditions were imposed to the structure in the range of 75-120F. elements in aerospace applications. The lug The frequency response functions and time series assembly is fabricated from 25-mm thick Al 7075- T651 plate, 375 x 270 mm, shown in Figure 2. One data were measured at each stage of temperature and the damage condition was imposed in sequent as side of this structure is bonded with a composite follows. plate using 10 bolted joints at the torque level of 220 - D1: loosening one bolt to 100 in-lb, in-lb. The typical failure modes for this lug- - D2: to 20 in-lb assembly were identified as a fatigue crack at the tip - D3: loosening two bolts to 100 in-lb, of the lug and the wing, the loosening mode of joint - D4: to 20 in-lb failure, and fatigue crack initiation at bolt holes. Similar temperature variations (75-100F) were also Total 10 piezoelectric transducers (five 12.7-mm imposed into these damaged conditions. diameter and five 6.3-mm diameter) were installed on one surface of the lug as shown in the figure 2 Figure 2. A lug assembly Figure 3. The SHM results using FRF measurements and SHMTools. The first figure shows the result that the 4. SHM Procedure baseline training data do not include temperature It is a well known fact that frequency response variations, while the second figure includes the variation. functions (FRFs) represents a unique dynamic characteristic of a structure. From the standpoint of Figure 3 show a correlation-based damage metric SHM, damage will alter the stiffness, mass, or chart. The damage metric chart is constructed after energy dissipation properties of a system, which, in each measurement has been taken in order to give turn, results in the changes in the FRF 2 . some indication of the conditions of a structure

  3. “ SHMTOOLS” FOR SHM AND SENSOR DIAGNOSTICS: LUG ASSEMBLY APPLICATIONS through comparison with the reference baselines along with temperature variations are measurement. As can be seen in the figure, the linearly separable from the damaged conditions in effects of temperature on the FRF measurements the two-dimensional projection. were remarkable that the first damage state (D1) could not be clearly identifiable. However, from the second damage state (D2: loosening a bolt to 20 in- lb) introduced noticeable changes in FRF signature and could be clearly identified. If one uses all the temperature variation to baseline training data, the result is made clearly improved. In addition to FRFs, SHM techniques based on time series predictive models were also implemented. It was however concluded that the residual error, which is the difference between the measured and Figure 5. PCA projection of AR parameters. The the ARX predicted signal, was not suitable damage separation of damaged and undamaged conditions are indicator, as shown in Figure 4. With the induced clearly observed. temperature variations, the residual error increases which makes impossible to distinguish the damaged Figure 6 illustrates the Mahanobis squared distance- condition from undamaged ones. based damage metric values. The first 70 baselines in the temperature range of 80-125 F were included in the training set and the remaining data are used for damage identification. The figure clearly suggests that the Mahalanobis distance provides a clear damage indicator that can discriminate the damaged conditions from undamaged conditions in the presence of temperature variations. Figure 4. RMSE of residual error. Large increase in the residual error that damage could not be identifiable. However, the statistical analysis on the identified AR and X parameters shows the much better damage detection capability. Figure 5 shows the AR parameters projected onto the first two principle Figure 6. Mahalanobis squared distance using the AR components. Principle component analysis (PCA) is parameters a classical linear technique of multivariate statistics It should be emphasized that the aforementioned for mapping multidimensional data into lower SHM data processing techniques are embedded in dimension with minimal loss of information. In the SHMTools software, and can be easily SHM, PCA has been used for several purposes assembled. By integrating various data interrogation (evaluation of patterns, feature cleansing, feature and signal processing algorithms, this powerful selection), herein it is used only for feature SHM tool enhances the visibility and interpretation visualization. The visualization of these parameters of SHM methods related to damage identification in the transformed space shows that each state condition clusters well in such a way that the 3

Download Presentation
Download Policy: The content available on the website is offered to you 'AS IS' for your personal information and use only. It cannot be commercialized, licensed, or distributed on other websites without prior consent from the author. To download a presentation, simply click this link. If you encounter any difficulties during the download process, it's possible that the publisher has removed the file from their server.

Recommend


More recommend