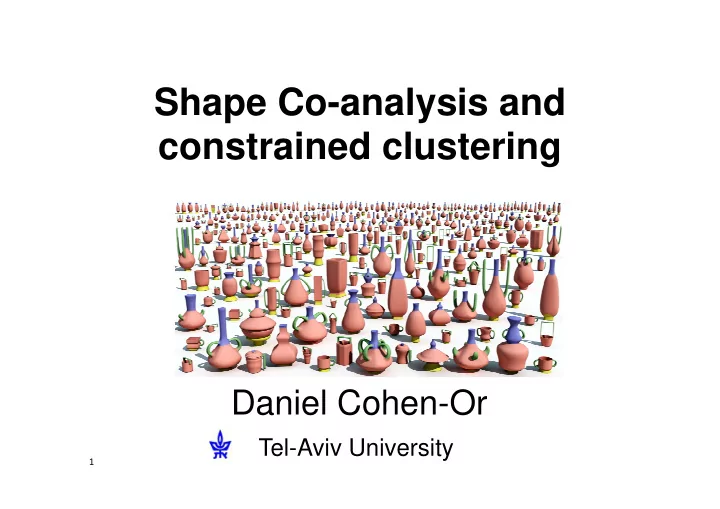
SLIDE 1 Shape Co-analysis and constrained clustering
Daniel Cohen-Or
Tel-Aviv University
1
SLIDE 2 High-level Shape analysis
2
Shape abstraction
[Mitra et al. 10] [Mehra et al. 08] [Fu et al. 08]
Upright orientation Illustrating assemblies
[Wang et al. 11]
Symmetry hierarchy
Learning segmentation
[Kalograkis et al. 10]
Exploration of shape collections
[Kim et al. 12]
SLIDE 3 Segmentation and Correspondence
3
Segmentation Correspondence
SLIDE 4 Individual vs. Co-segmentation
4
SLIDE 5 Individual vs. Co-segmentation
5
SLIDE 6 Challenge
6
Similar geometries can be associated with different semantics
SLIDE 7 Challenge
7
Similar semantics can be represented by different geometries
SLIDE 8 Large set are more challenging
8
Methods do not give perfect results
SLIDE 9 11
[Sidi et al.11]
Descriptor-based unsupervised co-segmentation
SLIDE 10 co-segmentation
12
Clustering in feature space
SLIDE 11
Clustering (basic stuff)
Takes a set of points,
SLIDE 12
Clustering (basic stuff)
Takes a set of points, and groups them into several separate clusters
SLIDE 13
Clustering is not easy…
– Clean separation to groups not always possible – Must make “hard splitting” decisions – Number of groups not always known, or can be very difficult to determine from data
SLIDE 14
Clustering is hard!
SLIDE 15
Clustering is hard!
Hard to determine number of clusters
SLIDE 16
Clustering is hard!
Hard to determine number of clusters
SLIDE 17
Clustering is hard!
Hard to decide where to split clusters
SLIDE 18
Clustering
Hard to decide where to split clusters
SLIDE 19 Clustering
- Two general types of input for Clustering:
– Spatial Coordinates (points, feature space), or – Inter‐object Distance matrix
SLIDE 20 Clustering
Spatial Coordinates (points, feature space), or Inter‐object Distance matrix
?
K‐Means, EM, Mean‐Shift, Linkage, DBSCAN, Spectral Clustering
SLIDE 21
Clustering 101
SLIDE 22 Initial co-segmentation
- Over-segmentation mapped to a descriptor
space (geodesic distance, shape diameter function, normal histogram)
24
High‐dimensional feature space
SLIDE 23
Co‐segmentation
Points represent some kind of object parts, and we want to cluster them as means to co‐ segment the set of objects
SLIDE 24 Clustering
- Underlying assumptions behind all clustering
algorithms:
– Neighboring points imply similar parts.
SLIDE 25 Clustering
- Underlying assumptions behind all clustering
algorithms:
– Distant points imply dissimilar parts.
SLIDE 26 Clustering
- When assumptions fail, result is not useful:
– Similar parts are distant in feature space
SLIDE 27 Clustering
- When assumptions fail, result is not useful:
– Dissimilar parts are close in feature space
SLIDE 28 Clustering
- Assumptions might fail because:
– Data is difficult to analyze – Similarity/Dissimilarity of data not well defined – Feature space is insufficient or distorted
SLIDE 29
Add training set of labeled data (pre‐clustered)
Supervised Clustering
SLIDE 30
Then clustering becomes easy…
Supervised Clustering
SLIDE 31 Supervised segmentation
34
Labeled shape
Head Nec k Torso Leg Tail Ear
Input shape Training shapes
[Kalogerakis et al.10, van Kaick et al. 11]
SLIDE 32 Semi‐Supervised Clustering
- Supervision as pair‐wise constraints:
– Must Link and Cannot‐Link
Can’t Link Must Link
SLIDE 33 Semi‐Supervised Clustering
- Cluster data while respecting constraints
SLIDE 34 Learning from labeled and unlabeled data
39
SLIDE 35 Supervised learning
40
SLIDE 36 Unsupervised learning
41
SLIDE 37 Semi-supervised learning
42
SLIDE 38 Constrained clustering
43
Cannot Link Must Link
SLIDE 39
Active Co‐analysis of a Set of Shapes Wang et al. SIGGRAPH ASIA 2012
SLIDE 40 Active Co-Analysis
- A semi-supervised method for co-segmentation
with minimal user input
45
SLIDE 41 Automatically suggest the user which constraints can be effective
Initial Co-segmentation Constrained Clustering Final result Active Learning 46
SLIDE 42 Cannot Link Must Link
Constrained Clustering
53
SLIDE 43 Spring System
- A spring system is used to re‐embed all the
points in the feature space, so the result of clustering will satisfy constraints.
SLIDE 44 Spring System
- Result of clustering after re‐embedding
(mistakes marked with circle):
Result of Spring Re‐embedding and Clustering Final Result
SLIDE 45 Spring System
Neighbor Spring Must‐Link Can’t Link Random Springs
SLIDE 46
SLIDE 48 65
Constrained clustering & Co-segmentation
SLIDE 49 Uncertain points
- “Uncertain” points are located using the
Silhouette Index:
Darker points have lower confidence
68
SLIDE 50 Silhouette Index
- Silhouette Index of node x:
69
SLIDE 51 Constraint Suggestion
- Pick super-faces with lowest confidence
?
- Pick the highest confidence super-faces
- Ask the user to add constraints between such pairs
70
SLIDE 53 Candelabra: 28 shapes, 164 super-faces,24 constraints
73
SLIDE 54 Fourleg: 20 shapes, 264 super-faces,69 constraints
74
SLIDE 55 Tele-alien: 200 shapes, 1869 super-faces,106 constraints
75
SLIDE 56 Vase: 300 shapes, 1527 super-faces,44 constraints
76
SLIDE 57
Cannot‐Link Springs
SLIDE 58 Constraints as Features
CVPR 2013
- Goal: Modify data so distances fit constraints
- Basic idea:
– Convert constraints into extra‐features that are added to the data (augmentation) – Recalculate the distances – Unconstrained clustering of the modified data – Clustering result more likely to satisfy constraints
- Apply this idea to Cannot‐Link constraints
- Must‐Link constraints handled differently
SLIDE 59 Cannot‐link Constraints
- Points should be distant.
- What value should be given: D(c1, c2) = X ?
– Should relate to max(D(x, y)), but how?
- If modified, how to restore triangle‐inequality?
SLIDE 60 Constraints as Features
– Add extra‐dimension, where Cannot‐Link pair is far away (±1):
SLIDE 61 Constraints as Features
– Add extra‐dimension, where Cannot‐Link pair is far away (±1): – What values should other points be given?
SLIDE 62 Constraints as Features
– Points closer to c1 should have values closer to +1, – Points closer to c2 should have values closer to ‐1
- Formulation:
- Simple distance does not convey real
closeness.
SLIDE 63 Constraints as Features
- Point A should be “closer” to c1, despite
smaller Euclidean distance.
A c1 c2 A
SLIDE 64 Constraints as Features
- Use a Diffusion Map, where this holds true.
A c1 c2 A
SLIDE 65 Constraints as Features
- Diffusion Maps related to random walk
process on a graph
- Affinity Matrix:
- Eigen‐Analysis of normalized A forms a
Diffusion Map:
SLIDE 66 Constraints as Features
- Use Diffusion Map distances:
- Calculate value of each point in new
dimension:
SLIDE 67 Constraints as Features
- Create new distance matrix, of distances in the
new extra dimension:
- Add distance matrix per Cannot‐Link:
- Cluster data by modified distance matrix
SLIDE 68
Constraints as Features
Original Springs Features
SLIDE 69
Constraints as Features!!!
Unconstrained clustering of the modified data
SLIDE 70
Results – UCI (CVPR 2013)
SLIDE 71 Summary
- A new semi‐supervised clustering method.
- Constraints are embedded into the data,
reducing the problem to an unconstrained setting.
SLIDE 73
SLIDE 74
SLIDE 75
SLIDE 76
SLIDE 77
SLIDE 78
SLIDE 79
SLIDE 80