setting expectations
play

Setting expectations Economic Evaluation Not possible to be an - PDF document

10/9/17 Incorporating Setting expectations Economic Evaluation Not possible to be an expert in economic in Clinical & evaluation in one hour However, you will Translation Research 1) Understand the major types of economic


  1. 10/9/17 Incorporating Setting expectations… Economic Evaluation • Not possible to be an expert in economic in Clinical & evaluation in one hour • However, you will… Translation Research 1) Understand the major types of economic evaluation Fernando A. Wilson, PhD 2) Describe the economic evaluation process 3) Understand how to prepare a CTR study to Health Services Research & Administration College of Public Health be evaluated University of Nebraska Medical Center 4) Differentiate between return on investment and social return on investment 5) Understand the limitations of economic evaluation
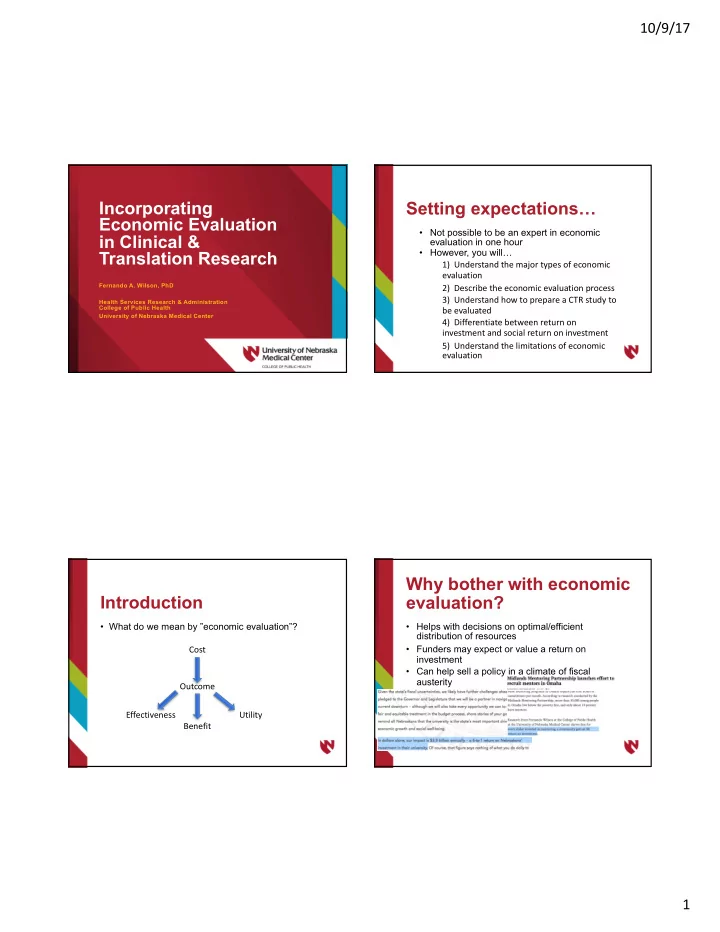
 Why bother with economic Introduction evaluation? • What do we mean by ”economic evaluation”? • Helps with decisions on optimal/efficient distribution of resources Cost • Funders may expect or value a return on investment • Can help sell a policy in a climate of fiscal austerity Outcome Effectiveness Utility Benefit 1

  2. 10/9/17 Last step…what are these Economic evaluation in 7 steps “ratios”? Identify Determine Describe • Three types of economic evaluation commonly Relevant Perspective Intervention used in healthcare: Costs/Benefits • Cost-effectiveness analysis (CEA) • Cost-benefit analysis (CBA) Determine Determine Collect Data Discount the Time • Cost-utility analysis (CUA) Rate Horizon Calculate Ratios Incremental Cost-Effectiveness Ratio (ICER) Overview of CEA • CEA compares the costs of achieving a particular nonmonetary objective, such as lives saved Difference in costs between intervention and status quo (alternative) ( C1 - C0 ) relative to improvement • CEA applies to problems where the goal is accepted at in health outcome between intervention and status the start and the problem is only to find the best, most quo ( E1 - E0 ): efficient, means to achieve it C1 - C0 ICER = E1 - E0 2

  3. 10/9/17 The cost-effectiveness plane Advantages/disadvantages of CEA • Conceptually, this approach amounts to identifying the lowest cost approach of producing a given benefit. • CEA is the first step toward undertaking a cost- benefit study. • If you run into significant problems in undertaking a CEA, it is unlikely that a CBA will be feasible. • A primary disadvantage is subjectivity of “willingness to pay” From Petrou & Gray(BMJ, 2011) Overview of Cost-Benefit Measurement issues Analysis (CBA) • May be difficult to monetize benefit or costs, • CBA = costs relative to monetary benefit especially in health care • Generally from a societal perspective • Value of life The benefits and costs of not only those • • Value of improving quality of life directly attributed to project but also any indirect benefits or costs 3

  4. 10/9/17 Estimates for the value of life vary substantially Methods in CBA • Three methods to place value on human life: • The human capital approach, estimates the present value of an individual ’ s future earnings • The willingness to pay or willingness to accept approach measures what individuals are willing to pay (accept) to avoid (accept) additional risk to life and limb • The contingent valuation approach elicits individuals valuation of alternative contingent risks From Viscusi & Aldi(2003, NBER) Other estimates on value of life What about ROI? • Special case of CBA • Perspective narrowed to a particular institution • Reported as either net present value (PV) dollar return or percentage return • %ROI = 100*(Dollar benefit – Dollar cost) / Dollar cost • CBA reported as an ICER (cost per dollar benefit gained), ratio of dollar benefit to cost, or as dollar difference between benefit to cost (net benefit) From US DOT Memorandum dated Aug. 8, 2016 4

  5. 10/9/17 Social Return on Overview of Cost-Utility Investment (SROI) Analysis • Similar to calculating ROI, PV of benefits relative to PV of costs • CUA uses quality-adjusted life-years as health- related outcome (QALY) • Benefits include non-traditional monetary measures using multiple perspectives • Projects evaluated on basis of their incremental costs per extra QALY delivered to the patients • Like CBA, non-pecuniary outcomes must be monetized, e.g., using “willingness to pay” approach • Expansive view of return on investment Cost utility and quality-adjusted Measurement life years (QALYs) ./012 𝐺 ) 𝑟 ) 𝑅𝐵𝑀𝑍 = ' 1 + 𝑒 ) • Scale bounded by 0 and 1 ./3 • Death = 0 and perfect mental/physical health = 1 • Mental and physical health assessed using self-reported where F i is the probability that the person is still general or disease-specific quality of life instruments alive at age i, d is the time discount factor, and the value q i is the quality weight. 5

  6. 10/9/17 Reenen et al(2014) – EQ-5D-Y User Guide. Available at: Reenen et al(2014) – EQ-5D-Y User Guide. Available at: http://www.euroqol.org/fileadmin/user_upload/Documenten/PDF/Folders_Flyers/EQ-5D-Y_User_Guide_v1.0_2014.pdf http://www.euroqol.org/fileadmin/user_upload/Documenten/PDF/Folders_Flyers/EQ-5D-Y_User_Guide_v1.0_2014.pdf Afterward, use an algorithm to derive utility weights… Advantages of QALYs Health State 11223 Full health � 1.000 Mobility: level 1 (subtract 0.000) Self-Care: level 1 (subtract 0.000) • ”Standardized” outcome (common yardstick) Usual Activities: level 2 (subtract 0.140) Pain/Discomfort: level 2 (subtract 0.173) • Can evaluate a wide range of disparate Anxiety/Depression: level 3 (subtract 0.450) D1: number of dimensions at level 2 or 3 beyond first � 2 (subtract � 0.140 � 2 � � 0.280) interventions & programs I2-squared: square of number of dimensions at level 2 beyond first � 1 (subtract 0.011 � 1 � 0.011) I3: number of dimensions at level 3 beyond first � 0 (subtract � 0.122 � 0 � 0.000) I3-squared: square of number of dimensions at level 3 beyond first � 0 (subtract � 0.0148 � 0 � 0.000) • Relatively easy to implement • Measures ”high level” outcomes from healthcare Hence, the predicted value for state 11223 is 1.000 � 0.000 � 0.000 � 0.140 � 0.173 � 0.450 � ( � 0.280) � 0.011 � 0.000 � 0.000 � 0.506 services • Increased life span • Decreased morbidities From Appendix 2 in Shaw et al(2005) – US valuation of the EQ-5D health states – Med Care 6

  7. 10/9/17 Illustration: organ transplant Critique of QALYs • Intervention costs $350,000, including direct and • Some may view it as “age-ist” indirect costs • Different survey instruments may provide • Fourteen patients lived an average of 4.46 months. different utility weights • CER = (Cost − Averted Future Costs) / Life-years gained. • Construction of QALYs is not really • CER = ($350,000 − 0) / (4.46/12) = $942,000. grounded in economic theory Cost-effectiveness after QALY activity scale definitions adjusting for quality of life • Assume health is poor after the operation. • Assume ‘Limited in ADL’ after the operation. • CER = $350,000 / ((4.46/12)×0.10) = $9,420,000. • Is this cost-effective? 7

  8. 10/9/17 Additional Reading • Gray AM, Clarke PM, et al. Applied Methods of Cost-effectiveness Analysis in Health Care . New York, NY: Oxford University Press; 2011 • Cape JD, Beca JM, Hoch JS. Introduction to cost-effectiveness analysis for clinicians. UTMJ 2013;90(3):103-5 • Viscusi WK, Aldy JE. The value of a statistical life: a critical review of market estimates throughout the world. NBER Working Paper 9487. February 2003 • Hirth RA, Chernew ME, et al. Willingness to pay for a quality-adjusted life year: in search of a standard. Med Decis Making. 2000;20:332-42 • Ubel PA, Hirth RA, Chernew ME, Fendrick AM. What is the price of life and why doesn't it increase at the rate of inflation? Arch Intern Med. 2003 Jul 28;163(14):1637- 41 • Neumann PJ, Cohen JT, Weinstein MC. Updating cost-effectiveness—the curious resilience of the $50,000-per-QALY threshold. NEJM 2014;371(9):796-7 • Gargani J. The leap from ROI to SROI: Farther than expected? Eval Prog Plan 2017; [Epub ahead of print] • Petrou S, Gray A. Economic evaluation alongside randomised controlled trials: design, conduct, analysis, and reporting. BMJ. 2011;342:d1548. Source: Cohen JT, Neumann PJ, Weinstein MC. (2008). Does preventive care save money? Health economics and the presidential candidates. N Engl J Med 358(7): 661-3. Thank you! Fernando A. Wilson, PhD Associate Professor, Health Services Research and Administration Acting Director, UNMC Center for Health Policy fernando.wilson@unmc.edu 8

Download Presentation
Download Policy: The content available on the website is offered to you 'AS IS' for your personal information and use only. It cannot be commercialized, licensed, or distributed on other websites without prior consent from the author. To download a presentation, simply click this link. If you encounter any difficulties during the download process, it's possible that the publisher has removed the file from their server.

Recommend


More recommend