
SLIDE 1
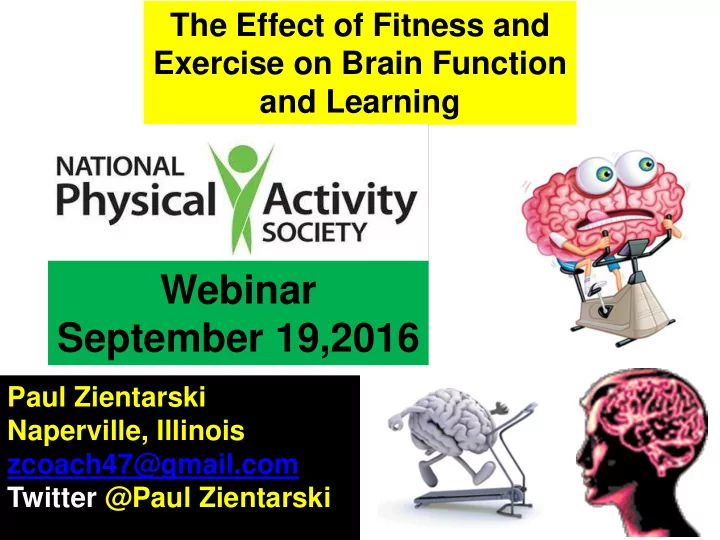
The Effect of Fitness and Exercise on Brain Function and Learning
Paul Zientarski Naperville, Illinois zcoach47@gmail.com Twitter @Paul Zientarski
September 19,2016 Paul Zientarski Naperville, Illinois - - PowerPoint PPT Presentation
The Effect of Fitness and Exercise on Brain Function and Learning Webinar September 19,2016 Paul Zientarski Naperville, Illinois zcoach47@gmail.com Twitter @Paul Zientarski 2001 Grade 5 SAT 9 and Physical Fitness Scores Higher academic
The Effect of Fitness and Exercise on Brain Function and Learning
Paul Zientarski Naperville, Illinois zcoach47@gmail.com Twitter @Paul Zientarski
2001 Grade 7 SAT 9 and Physical Fitness Scores 26 31 34 41 50 60 28 32 36 44 54 66 10 20 30 40 50 60 70 1 2 3 4 5 6 Number of Fitness Standards Achieved SAT 9 Percentile Reading Mathematics 2001 Grade 5 SAT 9 and Physical Fitness Scores 29 32 36 40 46 55 36 40 45 50 58 71 10 20 30 40 50 60 70 80 1 2 3 4 5 6 Number of Fitness Standards Achieved SAT 9 Percentile Reading Mathematics Grade 9 SAT 9 and Physical Fitness Scores 21 24 28 31 37 45 35 38 43 51 58 67 10 20 30 40 50 60 70 80 1 2 3 4 5 6 Number of Fitness Standards Achieved SAT 9 Percentile Reading Mathematics
Higher academic achievement is associated with higher levels of fitness in grade 5,7,9. The relationship between academic achievement and fitness in grade 5,7,9 was greater in mathematics than in reading, particularly at high fitness levels.
0 1 2 3 4 5 6
Figure 2 shows these same results using 2004 CST in mathematics scale scores
300 308 316 322 330 342 358 294 300 308 315 322 334 350 317 319 324 330 336 346 361 280 290 300 310 320 330 340 350 360 370 1 2 3 4 5 6 Overall PFT Score CST Math Scale Score Grade 5 Grade 7 Grade 9
1 3 2 4 5 6
2.47 Million Students tested
Most telling tests for Academic Success Cardiovascular Fitness
10 20 30 40 50 60 70 80 90 100
E x e m p l a r y R e c
n i z e d A c c e p t a b l e U n a c c e p t a b l e CV Fitness Corresponds with Academic Performance when Schools Stratified by State Rating System
Texas Youth Fitness Study
CV TAKS
2.47 Million students tested 2011
Performed - study of all Swedish men born between 1950 on 1976--- who entered the MILITARY— At age 18 They had grades and test scores at 15 and test scores on entering military at 18. As well they had information on physical fitness at 15 and 18 and made their analyses.
270,000 were siblings 3100 were fraternal twins 1432 were identical twins The sample included a total of 1,221,727 men The finding was that higher IQ scores were found in those men with the better cardiovascular conditioning, even when comparing TWINS! TWINS!
Students who showed a moderate improvement in physical education scores (cardiovascular) — a 25 percent improvement or less — achieved best in the entrance exam with 276 points on average, while students with a significant decline in cardiovascular performance — of more than 25 percent — scored lowest in the exam with 260 points on average.
Easy Test Hard Test
Higher Fit Lower Fit
9 and 10 year olds students
Slide Compliments of Dr. Chuck Hillman University of Illinois
221 8-9 year old students
9 I N M T O E N R T V H E N T I O N
Brains after sitting quietly Brains after 20 minute walk
Research/Brain Scan Compliments of Dr. Chuck Hillman University of Illinois
“Consistent exercise, and certain types of specific exercises, can both temporarily and permanently affect the way your brain is able to focus, its ability to deal with stress and anxiety, and its ability to learn …
“Exercise is like fertilizer for the brain … it’s so good, it’s like Miracle Gro”.
Enhanced Academic Performance
Brain Derived Neurotrophic Factor
BDNF is a neurotrophin whose status as a regulator
differentiation of neurons during development has matured to include the adult nervous system. BDNF functions to translate activity into synaptic & cognitive plasticity in the adult animal.
ain Deriv ived ed Neur urotr trophic
actor
A brain that's low on BDNF shuts itself off to new information, and groups that are deprived of this chemical are not as quick or sharp as those with adequate amounts. Until the mid-Nineties it was thought that the adult loss of nerve cells was irrevocable, but studies over the past decade have overturned that assumption, showing that "neurogenesis" (formation of nerve tissue) in some parts of the brain can be induced easily with exercise.
Dopamine Reward Pleasure Motivation/Drive Serotonin Obsessions Compulsions Memory Norepinepherine Alertness Concentration Energy Attention Anxiety Impulse Irritability Appetite Sex Aggression Mood Cognitive Function
Typical 5 year old 5 to 7 minutes Typical 13 year old 15 to 18 minutes Typical Adult 20 to 25 minutes
with the condition than girls
discipline problems
Statistics from the Institute of Mental Health
More Time Needed for Academics Discipline Problem Didn’t Finish Their Work NO Recess
NO PE
What does L.R.P.E. Look Like ?
Based on Fitness Cardiovascular Intensity 155 -200bpm Cross Lateral Activities Core Strength Team Building Balance and Gymnastics Traditional Team Sports Academic Support While Exercising
Source: Welk G. Cardiovascular Fitness and Body Mass Index are Associated with Academic Achievement in Schools. Dallas, Texas: Cooper Institute, March 2009
Return on Investment: Better attendance = more kids learning
Student Fitness and BMI Levels Correlate with Attendance and Disciplinary Incidents
0.52
0.18
0.2 0.4 0.6
Better attendance Correlation coefficients Healthy fitness zone for cardiovascular health Healthy fitness zone for BMI Fewer disciplinary incidents
Anthony Elementary in Leavenworth, KS
YEAR
UNSATISFACTORY ADVANCED EXEMPLARY
2002 25.9% 0% 7.4% 2003 25% 19.4% 8.3% 2004 11.1% 33.3% 18.5%
YEAR
UNSATISFACTORY ADVANCED EXEMPLARY
2002 40.5% 5.4% 2.7% 2003 27.3% 18.2% 3.0% 2004 0% 23.8% 47.6% Reading Assessment Math Assessment
In 2004 Anthony increased PE and PA from once to five days a week. They went from 10th in Reading and 9th in Math (in a district of 10 schools) to 2nd in Reading and 1st in Math. Their disciplinary office referrals dropped from 438 to 18. The number of students passing the Presidential Fitness Test increased by over 1300%.
Anthony Elementary in Leavenworth, Kansas Edutopia (Dec/Jan 2006)
In 2004 Anthony increased PE and PA from one to five days a week, revamped their school lunch program, and added vitamins to the daily menu. Anthony had three remarkable changes in one year:
1. There was a 1300+% increase in those passing the fitness test. 2. They went from 10th in Reading and 9th in Math (in a district with 10 elementary schools) to 2nd in Reading and 1st in Math.
Cobb County Georgia
process
Mentally, Physically, Emotionally, and Socially Thank you for attending this webinar!