Sensitivity analysis for CCI-2 test using CORQUENCH Jaehyun Ham a * , - - PDF document

sensitivity analysis for cci 2 test using corquench
SMART_READER_LITE
LIVE PREVIEW

Sensitivity analysis for CCI-2 test using CORQUENCH Jaehyun Ham a * , - - PDF document

Transactions of the Korean Nuclear Society Virtual Spring Meeting July 9-10, 2020 Sensitivity analysis for CCI-2 test using CORQUENCH Jaehyun Ham a * , Sang-Ho Kim a , Sangmin Kim a , Jaehoon Jung a a Korea Atomic Energy Research Institute, 111,


slide-1
SLIDE 1

Sensitivity analysis for CCI-2 test using CORQUENCH

Jaehyun Ham a*, Sang-Ho Kim a, Sangmin Kim a, Jaehoon Jung a

aKorea Atomic Energy Research Institute, 111, Daedeok-daero 989 beon-gil, Yuseong-gu, Daejeon,

Republic of Korea 34057

*Corresponding author: jhham@kaeri.re.kr

  • 1. Introduction

Molten Core-Concrete Interaction (MCCI) is one of main phenomena that occurs during the ex-vessel corium cooling. When MCCI occurs, the concrete is gradually eroded by the high temperature corium. The erosion can damage the basemat of a containment, so evaluation of the MCCI is very important to the containment safety analysis. There are several codes to simulate the MCCI such as CORQUENCH, COCO, CORCON, COSACO, MAAP, MEDICIS, TOLBIAC-ICB, WECHSL, and so on. To simulate the MCCI, many other phenomena should be also considered such as water ingression, melt eruption, and so on. Because there are various models for these phenomena, the effect of uncertainties have to be identified for better understanding of the simulation result. In this research, the effects of the several uncertainty factors were analyzed using CORQUENCH 4.1b. First, result comparison

  • f

CCI-2 test between the CORQUENCH simulation and the experiment to build the reference model. Thereafter, sensitivity analysis was done by changing values for uncertainty factors based

  • n the reference model.
  • 2. Methods and Results

2.1 Result Comparison of CCI-2 test between CORQUENCH simulation and Experiment CORQUENCH has been developed to assess the phenomenological model of various ex-vessel corium cooling mechanisms by ANL since the early 1990’s. The code has a multi-nodal analysis capability that can treat variations in core debris distributions arising from containment geometry effects, and the extent of core debris spreading following vessel breach under either wet or dry cavity conditions [1]. Since the 1980s, a number of MCCI experiments have been conducted for the post-filled cavity condition. Among these experiments, CCI-2 test was selected to simulate because this test performed systematically for MCCI behavior analysis and can demonstrate scale effects [2]. CCI-2 test provides data on the nature and extent of debris quenching under both early- and late- phase cavity flooding conditions. This test utilized a concrete cavity that was in the shape of a 2-D notch with the square cross-sectional basemat. The two walls between the tungsten electrodes were fabricated from concrete to allow the ablation to proceed laterally as well as axially. Thermite was used to produce the melt. The reference model of CORQUENCH for CCI-2 test was constructed based on references; [1], [2] and [3]. The main input for the model is shown in table I.

Table I: Reference model of CORQUENCH for CCI-2 test Parameter (Variable name) Input model/value Concrete ablation (NABBL) (0) Quasi-steady concrete ablation Water ingression (NINGRS) (2) Time dependent crust dryout limit calculated with the Lister/Epstein model. Melt eruption and particle bed formation (NENTR) (2) Ricou-Spalding entrainment rate correlation Viscosity calculation (NVISC) (1) Ishii-Zuber correlation Maximum solid fraction (ALPMAX) 1.0 Top crust modeling (NUSGAP) (0) Always atop the melt Zr-SiO2 reaction (NCHEM) (1) Enabled Melt-concrete heat transfer coefficient (NBOTBC, NSIDEBC) (1) Bradley’s modification to Malenkov-Kutateladze correlation

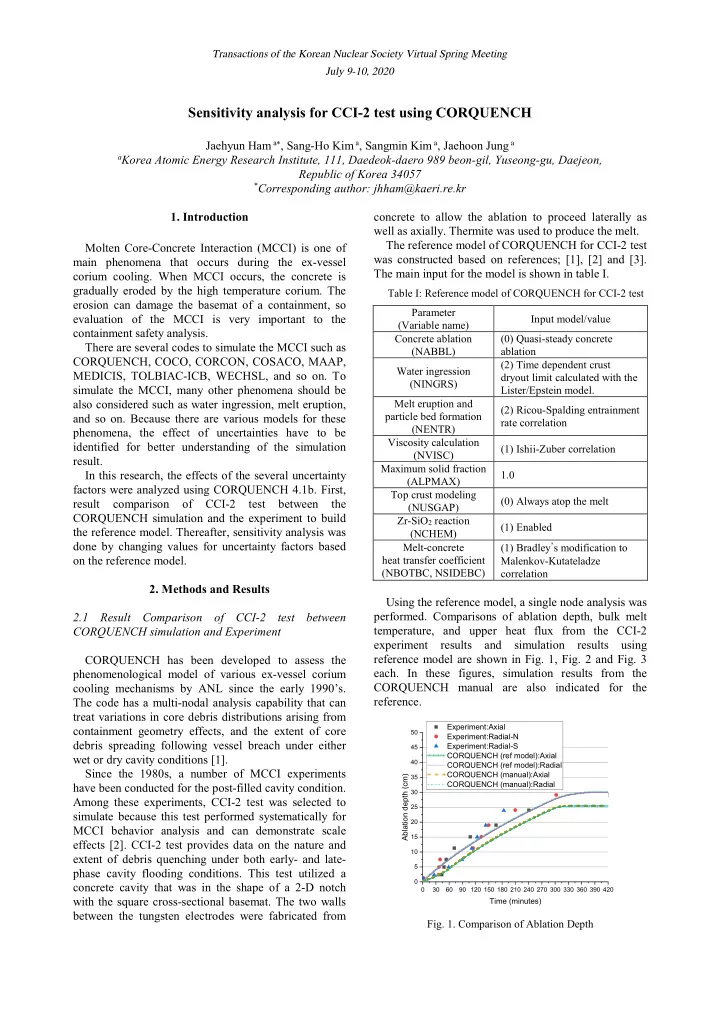
Using the reference model, a single node analysis was

  • performed. Comparisons of ablation depth, bulk melt

temperature, and upper heat flux from the CCI-2 experiment results and simulation results using reference model are shown in Fig. 1, Fig. 2 and Fig. 3

  • each. In these figures, simulation results from the

CORQUENCH manual are also indicated for the reference.

30 60 90 120 150 180 210 240 270 300 330 360 390 420 5 10 15 20 25 30 35 40 45 50

Ablation depth (cm) Time (minutes) Experiment:Axial Experiment:Radial-N Experiment:Radial-S CORQUENCH (ref model):Axial CORQUENCH (ref model):Radial CORQUENCH (manual):Axial CORQUENCH (manual):Radial

  • Fig. 1. Comparison of Ablation Depth

Transactions of the Korean Nuclear Society Virtual Spring Meeting July 9-10, 2020

slide-2
SLIDE 2

30 60 90 120 150 180 210 240 270 300 330 360 390 420 1400 1500 1600 1700 1800 1900 2000 2100 2200 2300 2400

Bulk melt temperature (K) Time (minutes) Experiment CORQUENCH (ref model) CORQUENCH (manual)

  • Fig. 2. Comparison of Bulk Melt Temperature

290 300 310 320 330 340 350 360 370 380 390 400 410 420 500 1000 1500 2000 2500 3000 3500

Upper heat flux (kW/m2) Time (minutes) Experiment CORQUENCH (ref model) CORQUENCH (manual)

  • Fig. 3. Comparison of Upper Heat Flux

In the simulation, axial and radial ablation depths were resulted as same because the same heat transfer coefficients from the Bradley’s correlation are used to axial and radial interface for melt-concrete heat transfer coefficient (NBOTBC, NSIDEBC) of the reference

  • model. The simulation result using reference model fit

the experiment result well in terms of the ablation depth,

  • n the other hand, the simulation results from the

manual under-predicts the ablation depth as shown in

  • Fig. 1. In terms of bulk melt temperature, simulation

results from the manual fit the experiment result better than the simulation results using reference model until the water injection (< 300 minutes). It is because concrete ablation models are different. In the reference model, quasi-steady concrete ablation (NABBL=0) was assumed, so the evolution and failure of crust layer between the melt and concrete are not considered. However, the transient dry-out model (NABBL=2) crust was assumed in the manual model. Therefore, early heat transfer from melt to concrete is larger in the result using reference model than in the result from the manual. The bulk melt temperatures in the experiment result and the simulation results are different after water injection (> 300 minutes) as shown in Fig. 2. The melt temperature decreases under the wet cavity condition in the simulation results, but rather the melt temperature increases in the experiment results. However, the upper heat flux increases rapidly right after the water injection in both the experiment result and the simulation results as shown in Fig. 3. After the bulk cooling phase, the upper heat flux steadily decreases as the crust is formed in the experiment result, on the other hand, it maintains constantly after rapid decrease in the simulation results. Although the results show different inclination, the

  • verall upper heat flux of the simulation results fit well

the experiment result under the wet-cavity condition. Thus, it seems that the difference of the heat flux within the melt is the reason why the bulk melt temperatures in experiment and simulation results are different. In the simulation, the whole melt is considered as a pool condition with a single temperature, on the other hand, the melt nearby the centerline in the experiment can be presumed as a locally solid based on the bulk melt temperature and upper heat flux results. Therefore, the difference in the melt temperature under the wet-cavity condition cannot be covered by the current analysis method in the CORQUENCH. In conclusion, the CCI-2 test simulation result using CORQUENCH 4.1b with the reference model reasonably fit the experiment result although the simulation result doesn’t fit well the experiment result in terms of the bulk melt temperature under the wet-cavity condition. 2.2 Sensitivity analysis Based on the CCI-2 test simulation result, three sensitivity variables were considered for concrete ablation (NABBL), concrete decomposition temperature (TDCL), and initial melt temperature (TMELTIC). Sensitivity analysis conditions are shown in Table II. Reference model inputs are marked with gray color. There are three models for the concrete ablation (NABBL); Quasi-steady concrete ablation, dryout model, and transient dryout model. Input values for concrete decomposition temperature (TDCL) are considered between the solidus temperature and the liquidus temperature of a limestone/common sand

  • concrete. In this analysis, the initial melt temperature

(TMELTIC) was considered from 2050 K to 2250 K, which the range is above the melt freezing point, 1975 K in the CORQUENCH 4.1b.

Table II: Sensitivity analysis condition Parameter (Variable name) Input model/value Concrete ablation (NABBL) (0) Quasi-steady concrete ablation (1) Dryout model (2) Transient dryout model Concrete decomposition temperature (TDCL) 1395 K 1430 K 1465 K 1500 K Transactions of the Korean Nuclear Society Virtual Spring Meeting July 9-10, 2020

slide-3
SLIDE 3

1535 K 1565 K Initial melt temperature (TMELTIC) 2050 K 2100 K 2150 K 2200 K 2250 K

Axial ablation depth and bulk melt temperature results according to the concrete ablation model are shown in Fig. 4 and Fig. 5 each.

30 60 90 120 150 180 210 240 270 300 330 360 390 420 5 10 15 20 25 30 35 40

Axial ablation Depth (cm) Time (minutes) NABBL=0 (reference) NABBL=1 NABBL=2

  • Fig. 4. Axial Ablation Depth according to Concrete Ablation

Model (NABBL)

30 60 90 120 150 180 210 240 270 300 330 360 390 420 1400 1500 1600 1700 1800 1900 2000 2100 2200 2300 2400

Bulk melt temperature (K) Time (minutes) NABBL=0 (reference) NABBL=1 NABBL=2

  • Fig. 5. Bulk Melt Temperature according to Concrete

Ablation Model (NABBL)

The difference of ablation depth based on the reference result according to the concrete ablation model is within 5 cm during the whole simulation time. There is not much difference among bulk melt

  • temperatures. The largest depth was shown when the

quasi-steady ablation model (NABBL=0) was used for the concrete ablation model, because conduction heat transfer into the concrete behind the ablation front, as well as the initial surface temperature rise to the ablation point, are neglected in the model. On the other hand, the least depth was shown when the transient dryout model (NABBL=2) was used because conduction into the concrete and the initial concrete heatup phase are both considered, along with interfacial corium crust growth in the model. Axial ablation depth and bulk melt temperature results according to the concrete decomposition temperature are shown in Fig. 6 and Fig. 7 each.

30 60 90 120 150 180 210 240 270 300 330 360 390 420 5 10 15 20 25 30 35 40 45

Axial ablation Depth (cm) Time (minutes) TDCL=1395K TDCL=1430K TDCL=1465K TDCL=1500K (reference) TDCL=1535K TDCL=1565K

  • Fig. 6. Axial Ablation Depth according to Concrete

Decomposition Temperature (TDCL)

30 60 90 120 150 180 210 240 270 300 330 360 390 420 1400 1500 1600 1700 1800 1900 2000 2100 2200 2300 2400

Bulk melt temperature (K) Time (minutes) TDCL=1395K TDCL=1430K TDCL=1465K TDCL=1500K (reference) TDCL=1535K TDCL=1565K

  • Fig. 7. Bulk Melt Temperature according to Concrete

Decomposition Temperature (TDCL)

The difference of ablation depth among all results according to the concrete decomposition temperature is almost 15 cm during the whole simulation time. The difference of bulk melt temperature among all results is almost 200 K until 300 minutes, which is the dry cavity

  • condition. When the concrete is decomposed at higher

temperature, the ablation depth gets lower and the bulk melt temperature gets higher because the temperature on the crust/concrete interface gets higher. Axial ablation depth and bulk melt temperature results according to the initial melt temperature are shown in Fig. 8 and Fig. 9 each.

Transactions of the Korean Nuclear Society Virtual Spring Meeting July 9-10, 2020

slide-4
SLIDE 4

30 60 90 120 150 180 210 240 270 300 330 360 390 420 5 10 15 20 25 30 35

Axial ablation Depth (cm) Time (minutes) TMELTIC=2050K TMELTIC=2100K TMELTIC=2150K (reference) TMELTIC=2200K TMELTIC=2250K

  • Fig. 8. Axial Ablation Depth according to Initial Melt

Temperature (TMELTIC)

30 60 90 120 150 180 210 240 270 300 330 360 390 420 1400 1500 1600 1700 1800 1900 2000 2100 2200 2300 2400

Bulk melt temperature (K) Time (minutes) TMELTIC=2050K TMELTIC=2100K TMELTIC=2150K (reference) TMELTIC=2200K TMELTIC=2250K

  • Fig. 9. Bulk Melt Temperature according to Initial Melt

Temperature (TMELTIC)

The result shows that axial ablation depth gets higher with higher melt temperature. The ablation rates are different according to the initial melt temperatures only within about 30 minutes. So there are not much difference among results. The bulk melt temperature becomes same regardless of the initial melt temperature after about 30 minutes. Because constant decomposition temperature on surface between melt and concrete is considered for the heat transfer without the crust layer when quasi-steady ablation model (NABBL=0) is used for the concrete ablation.

  • 3. Conclusions

The result comparison of CCI-2 test between CORQUENCH simulation and experiment, and sensitivity analysis were performed in this research. The effect

  • f

concrete ablation model, concrete decomposition temperature, and initial melt temperature

  • n the simulation result were identified by the

sensitivity analysis. It was analyzed that concrete decomposition temperature affects largely on the ablation depth and the bulk melt temperature. Current MCCI codes including CORQUENCH consider the concrete decomposition temperature as a constant, however, the temperature should be considered with detailed model based on the result of this research. For further study, a confirmation on the effect of the sensitivity factor related with water injection such as water ingression model, and so on are recommended based on other MCCI tests which are more focused on the wet cavity condition than CCI-2 test. Also, the mitigation capability evaluation of MCCI for the nuclear power plant using an advanced code based on this research are recommended. Acknowledgement This work was financially supported by the Korea Institute of Energy Technology Evaluation and Planning (KETEP) grant funded by the Korean government (Ministry of Trade, Industry and Energy) (No. 20193110100090). REFERENCES

[1] M. T. Farmer, The CORQUENCH Code for Modeling of Ex-Vessel Corium Coolability under Top Flooding Conditions, ANL-18/22, Aug., 2018. [2] Ji-Hun Kim, Sejin Kwon, Jinyoung Choi, Yong Jin Cho, Concrete ablation analysis for molten corium-concrete interaction mitigation strategy, Annals of Nuclear Energy 132 (2019) 615-627. [3] M. T. Farmer, S. Lomperski, D. J. Kilsdonk, and R. W. Aeschlimann, OECD MCCI Project 2-D Core Concrete Interaction (CCI) Tests: Final Report, OECD/MCCI-2005-TR, Feb., 2006. Transactions of the Korean Nuclear Society Virtual Spring Meeting July 9-10, 2020