Seneca Lake Watershed Management Plan March 5, 2012 Watershed - - PowerPoint PPT Presentation

seneca lake
SMART_READER_LITE
LIVE PREVIEW

Seneca Lake Watershed Management Plan March 5, 2012 Watershed - - PowerPoint PPT Presentation

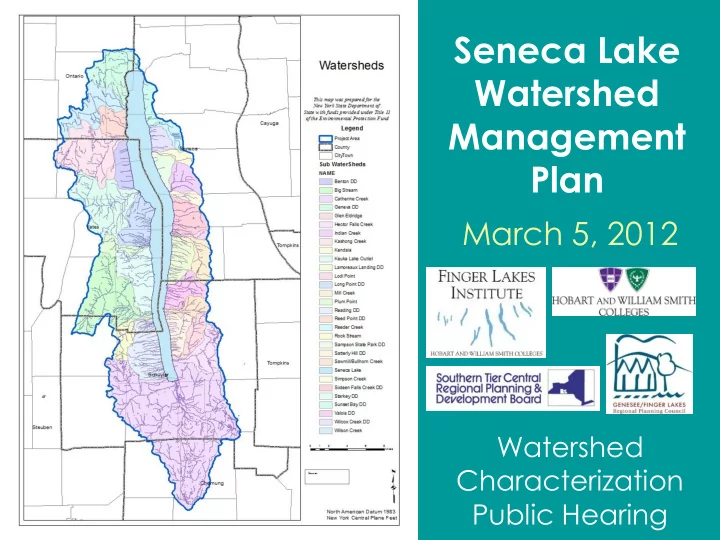
Seneca Lake Watershed Management Plan March 5, 2012 Watershed Characterization Public Hearing Sponsors This project is being prepared for the New York State Department of State with funds provided under Title 11 of the Environmental


slide-1
SLIDE 1

Seneca Lake Watershed Management Plan

March 5, 2012

Watershed Characterization Public Hearing

slide-2
SLIDE 2

Sponsors…

“This project is being prepared for the New York State Department of State with funds provided under Title 11 of the Environmental Protection Fund.”

slide-3
SLIDE 3

Sponsors…

City of Geneva, NY – EPF Project Sponsor

slide-4
SLIDE 4

Drawing from a Broad Coalition

Seneca Lake Area Partners In Five Counties SLAP-5 Soil and Water Conservation Districts in Five Counties

Various other federal, state and local agencies…

LOCAL CITIZENS & Other Stakeholders

Schuyler County Watershed Protection Agency

Cities, Towns, and Villages,,,

slide-5
SLIDE 5

Watershed…

All the land that drains into a common point (water body: stream or lake)

Marshak, 2012, Earth

slide-6
SLIDE 6

Seneca Lake Watershed

slide-7
SLIDE 7

Watershed Management Planning

Stages

  • Existing State
  • Desired State
  • Strategies and Actions

Balancing Act

  • Conflicting Uses
  • Restoration and Protection
  • Land use and Land Value
  • Tools in the Toolbox
  • Prioritize Issues and Target Funding
  • Coordination and Cooperation
slide-8
SLIDE 8

Watershed Management Planning

Four Legs of the Stool

  • Oversight and Involvement
  • Education and Outreach
  • Public Participation
  • Fact Finding
slide-9
SLIDE 9

Selection of Planning Activities to Date

  • Seneca Lake Area Partners in Five Counties

(SLAP-5)

  • Seneca Lake Watershed Study
  • 1999 Publication:

– Setting a Course for Seneca Lake: The State of the Seneca Lake Watershed

Since then:

  • Wide variety of additional local planning,

DEC work, water quality sampling & monitoring, and other activities by local governments, SWCDs and academia

slide-10
SLIDE 10

Watershed Management Plan

Components

  • Characterization and Sub-watershed

Prioritization – 2012

  • Public Comments – March 23
  • Assessment of Local Laws, Programs and

Practices Affecting Water Quality

  • Identification of Management Strategies
  • Implementation Strategy
  • Intermunicipal Coordinating Organization
  • Watershed Management Plan
slide-11
SLIDE 11

Seneca Watershed Characterization: The Setting

Seneca Lake

  • Largest of 11 Finger Lakes

– 57 km long (36 miles) – 3 km wide (2 miles) – 175 km2 SA (67 miles2) – 198 m deep – 15.54 km3 Volume (4.1 x 10¹² gal) – 18 years Residence Time

  • Feeds into the Oswego River Basin.
  • Ultimately drains northward into

Lake Ontario.

USGS Fact Sheet FS 180-99 http://www.dec.ny.gov/lands/ 53758.html

slide-12
SLIDE 12

Lake Level Control

  • Two Dams on Outlet

– Competing Interests

  • Water Supply

– 100,000 people

  • Upstream Levels

– Shore wells – Boating access – Winter protection – Flooding

  • Downstream Flows

– Min Flow Dilute Effluents – Max Flow Prevent Flooding – Hydroelectricity

USGS Fact Sheet FS 180-99 http://www.canals.ny.gov/faq/oswego/netdata/seneca-levels.pdf

slide-13
SLIDE 13

Municipal Involvement

  • Five Counties

– Chemung – Ontario – Schuyler – Seneca – Yates

  • Forty-One

Municipalities

slide-14
SLIDE 14

Climate

Mean Monthly Max & Min Temperatures by Decade 1970-2009

10 20 30 40 50 60 70 80 90

January February March April May June July August September October November December Tempertaure (*F)

Max 1970-79 Max 1980-89 Max 1990-99 Max 2000-09 Min 1970-79 Min 1980-89 Min 1990-99 Min 2000-09 Cornell Agricultural Research Station Data, Geneva, NY

Mean Monthly Precipitation by Decade 1970-2009

0.0 0.5 1.0 1.5 2.0 2.5 3.0 3.5 4.0 4.5

January February March April May June July August September October November December Precipitation (inches)

1970-79 1980-89 1990-99 2000-09 Cornell Agricultural Research Station Data, Geneva,

slide-15
SLIDE 15
  • Devonian

– Limestones

  • Tully & Onondaga

– Shales (Marcellus) – Siltstones – Sandstones

  • Underlying Silurian

– Evaporites

  • Gypsum (CaSO4)
  • Halite (NaCl)
  • Glacial Tills
  • Soils

Surface Bedrock

slide-16
SLIDE 16

Soils Groups

  • A. Soils with low

runoff potential.

  • B. Soils having

moderate infiltration rates

  • C. Soils having slow

infiltration rates

  • D. Soils with high

runoff potential.

slide-17
SLIDE 17

Aquifers

slide-18
SLIDE 18

Topography and Steep Slopes

http://fli.hws.edu/maps.asp

slide-19
SLIDE 19

Population

(87,000)

Population Growth

(1970 to 2010, 1.4%)

& Population Density

  • C. Geneva ~13,300, -21%
  • T. Geneva ~3,300, 18%

Hector ~4,900, 35% Dix ~3,800, -8% Fayette ~3,900, 31% Ovid ~2,300, -25% Romulus ~4,300, 1% Benton ~2,800, 31% Milo ~7,900, 15% V Penn Yan ~5,200, 0% Starkey ~3,600, 28% Veteran ~3,300, -6%

slide-20
SLIDE 20

Parcel Classification

  • Agriculture - 42%
  • Residential - 27%
  • Vacant Land - 14%
  • Commercial - 1%
  • Recreational - 1%
  • Community Service - 5%
  • Industrial - 1%
  • Public Services - 1%
  • Wild, Forested,

Conservation - 6%

  • Unclassified - 1%
slide-21
SLIDE 21

Land Cover Classification

  • Water – 13%
  • Developed, Open – 4.9%
  • Developed, Low Impact – 1.3%
  • Developed, Med. Impact – 1%
  • Developed, High Impact – 0.1%
  • Barren Land – <0.1%
  • Forests – 26.5%
  • Scrub/Grasslands – 7.1%
  • Hay, Crops – 42.5%
  • Wetlands – 4.3%
slide-22
SLIDE 22

Gas Wells & Mines

slide-23
SLIDE 23

Local Pollution Sources

1999 State of the Lake Report

  • Agriculture
  • Chemical Bulk Storage
  • Forestry & Forestry

Practices

  • Landfills, Dumps &

Hazardous Waste Sites

  • Mined Lands
  • Petroleum Bulk Storage
  • Roadbank Erosion
  • Salt Storage & Deicing

Materials

  • Shore Residences

Environmental Health

  • SPDES Permits
  • Spills
  • Streambank Erosion

Not duplicated in the 2012 Characterization

slide-24
SLIDE 24
  • Survey 4 Lake Sites & Buoy

– Weekly – CTD Profiles – Secchi Depths – Water Samples

  • Chlorophyll
  • Nutrients (NO3, TP, SRP)
  • Turbidity, Major Ions

– Occasionally 9 Sites

  • 5-6 Stream Sites

– Weekly – Discharge – Water Samples

  • Nutrients (NO3, TP, SRP)
  • Turbidity, Major Ions

– Occasionally 20 Sites

Limnology & Stream Hydrogeochemistry

slide-25
SLIDE 25

Lake CTD Data

John Halfman, HWS

Temperature Specific Conductance, Salinity Dissolved Oxygen PAR, Available Light Photosynthesis Fluorescence, Algal Concentrations Turbidity

slide-26
SLIDE 26

Seasonal & Shorter Changes: Seneca Lake Buoy Data

John Halfman, HWS http://fli-data.hws.edu/clarkpt/

2007 2008 2009 2010

slide-27
SLIDE 27

Buoy Data – Lakes Change Response to Weather

2011 2010 2009 2008 2007 2006

slide-28
SLIDE 28

Seneca Lake Salinity

John Halfman, HWS

Cathy Caiazza (WS’05)

Sodium Finger Lakes 20 40 60 80 100 Finger Lakes Sodium (ppm)

Canandaigua Cayuga Conesus Hemlock Honeoye Keuka Otisco Owasco Skeneateles Seneca

Seneca Lake

slide-29
SLIDE 29

Extra Source: Sodium Ions:

Mass balance data

Mike Wing & John Halfman, HWS

Seneca Lake

80 ppm (~1.2 million tons) Streams 20 ppm 15,000 mt/yr Road Salt Outlet 80 ppm 60,000 mt/yr Evaporation ~0 ppm Concentrates Ions Rain ~0 ppm Dilutes Ions in Lake

Industry? Groundwater / Rock Salt Bedrock?

40 to 45,000 mt/yr Sodium (~450 railroad cars) plus 60 to 70,000 mt/yr Chloride (~680 railroad cars)

slide-30
SLIDE 30

Century Scale Changes

Seneca Lake

20 40 60 80 100 120 140 160 180 200 1900 1910 1920 1930 1940 1950 1960 1970 1980 1990 2000 2010

Year

Chloride, ppm

Jolly Halfman Others

Cayuga, Skaneateles & Hemlock

20 40 60 80 100 120 140 160 180 200 1900 1910 1920 1930 1940 1950 1960 1970 1980 1990 2000 2010

Year Chloride (ppm)

Cayuga Skaneateles Hemlock

Glen Jolly, USGS Glen Jolly, USGS

slide-31
SLIDE 31

Algae & Water Clarity

John Halfman, HWS

Secchi Depths Annual Average

1 2 3 4 5 6 7 8 9

1991 1992 1993 1994 1995 1996 1997 1998 1999 2000 2001 2002 2003 2004 2005 2006 2007 2008 2009 2010 2011

Secchi Depth (m)

Chlorophyll-a Annual Average

0.0 0.5 1.0 1.5 2.0 2.5 3.0 3.5 4.0 4.5 5.0

1991 1992 1993 1994 1995 1996 1997 1998 1999 2000 2001 2002 2003 2004 2005 2006 2007 2008 2009 2010 2011

Chlorophyll-a (ug/L)

Surface Bottom

slide-32
SLIDE 32

Zebra / Quagga Mussels Nutrient Loading

slide-33
SLIDE 33

Declining Zebra & Quagga Mussels?

Zebra & Quagga Mussels

14222 12057 16088 6421 878 1354 22870 17030 12937 8228.3 100 90 41 27 6

5,000 10,000 15,000 20,000 25,000 2000 2001 2002 2003 2007 2011 Mussel Density (Ind/m

2)

20 40 60 80 100 Zebra Mussel Percentage (%)

Zebras Quaggas % Zerbas

Zebra Quagga Density

20 40 60 80 100 120 140 160 180 10,000 20,000 30,000 40,000 Density (Individuals/m2) Water Depth (m)

2011 Zebras 2011 Quaggas 2007 Zebras 2007 Quaggas 2002 Zebras 2002 Quagga 2001 Zebras 2001 Quaggas

Zebra & Quaggas 30 - 130 m

500 1000 1500 2000 2500 3000 3500 4000 2001 2011 Mussel density (#/m^2) Quagga Zebras

Unpublished data from Halfman (‘00, ‘01, ‘03), Dittman (‘01, ’11), Shelley (‘02), Zhu (‘07)

slide-34
SLIDE 34

Dissolved Phosphate Average Annual Concentration

20 40 60 80 100

Seneca Lake Castle Wilson Kashong Keuka Outlet Plum Pt. Big Stream Catharine Reeder Kendig

SRP (ug/L, P)

1999 2000 2001 2002 2003 2004 2005 2006 2007 2008 2009 2010 2011

118, 197, 145, 102, 120, 116, 298

Seneca Streams: Nutrient Loading

John Halfman, HWS

Agriculture Agriculture Wastewater Treatment CAFO/Depot Urban/Agriculture

slide-35
SLIDE 35

Phosphorus Budget

John Halfman, HWS Seneca Surplus 45 mt/yr

Sources Streams – 40 mtons/yr Atmosphere – 1 mtons/yr Municipal WWTF – 2.5 mtons/yr Septic Systems – 5 mtons/yr Lawn Care? Sinks Outlet – 8 mtons/yr Sediment – 1.5 mtons/yr

slide-36
SLIDE 36

Nutrient Delivery Owasco

John Halfman, HWS

Total Suspended Solids Autosampler (8 hr samples)

10 20 30 40 50 60 70 80 90 100 6/6 6/16 6/26 7/6 7/16 7/26 8/5 8/15 8/25 9/4 9/14 9/24 10/4 10/14 10/24 Date (2011) TSS (mg/L) 10 20 30 40 50 Stage (cm)

TSS (mg/L) Stage (cm) Precipitation (mm)

Total Phosphates Autosampler (8 hr samples)

20 40 60 80 100 120 140 160 6/6 6/26 7/16 8/5 8/25 9/14 10/4 10/24 Date (2011)

TP (ug/L, P)

10 20 30 40 50 Stage (cm)

Total Phosphate (µg/L, TP) Stage (cm) Precipitation (mm)

Dutch Hollow Hourly Readings

Stage, Cond., Temperature

Dutch Hollow Autosampler 3 Water Samples/Day

slide-37
SLIDE 37

Finger Lakes Water Quality

John Halfman, HWS

Mean Rank vs. Agricultural Land Use

R2 = 0.90 1 2 3 4 5 6 7 8 10 20 30 40 50 60 Agricultural Land Use (%) Mean Water Quality Rank

Honeoye Excluded Skaneateles Canandiagua Keuka Seneca Owasco Cayuga

2005-2011 Average Ranking

5 10 15 20 25 30 Honoeye Canandiagua Keuka Seneca Cayuga Owasco Skaneateles Otisco Water Quality Rank

Oligotrophic Mesotrophic Eutrophic

slide-38
SLIDE 38

Top Down Ecological Stress

Meghan Brown, HWS

Fishhook Water Flea Cercopagis pengoi Carnivorous Zooplankton Herbaceous Zooplankton Hemimysis anomala bloody red shrimp

slide-39
SLIDE 39

Other Benthic Organisms

Dawn Dittman, USGS

Benthic Organisms

200 400 600 800 1000 1200 1400 1600 1800 30 55 65 75 95 130

Water Depth (m) Densities (Ind/m2)

2001 Diporeia 2011 Diporeia 2001 Clams 2011 Clams 2001 Midges 2011 Midges 2001 Worms 2011 Worms

  • D. Dittman, unpublished Data
slide-40
SLIDE 40

“Bottom Up”, Zebra/Quagga Mussel and “Top Down” Stressors

slide-41
SLIDE 41

Stream Macroinvertebrates

Susan Cushman, HWS  Percent Modal Affinity Water Quality Index

Values > 65 No Impact Values 35 to 65 Slight Impact Values < 35 Severe Impact

Biotic Index 

Values < 4.5 No Impact Values > 5.5 Moderate Impact  Increased Impairment  Increased Impairment

slide-42
SLIDE 42

Preliminary Fish in Streams

Susan Cushman, HWS

Fish Abundance   Fish Species Richness

slide-43
SLIDE 43

Preliminary Mercury in Fish

Lisa Cleckner, HWS

Analyses on Blacknose dace (Lisa Cleckner). Action Level by FDA 1,000 ng/g, EPA screening value 300 ng/g (methyl Hg) No more than one meal of fish from Finger Lakes per week Historical Data Older (6yr) L Trout Avg: 400 ng/g Max: 578 ng/g

slide-44
SLIDE 44

Historical Data & Box Cores

Meghan Brown & Tara Curtin, HWS

Box Core Record   Historical Secchi & Chlorophyll Data

Historical Limnological Data

2 4 6 8 10 1900 1910 1920 1930 1940 1950 1960 1970 1980 1990 2000 2010

Year Secchi Depth (m) Chlorophyll-a (ug/L)

Secchi Depth Chlorophyll-a

slide-45
SLIDE 45

Total Mercury in Box Cores

Tara Curtin, HWS

Seneca Lake 

slide-46
SLIDE 46

Total Mercury in Box Cores

Tara Curtin, HWS

slide-47
SLIDE 47

Questions, Comments, Input

www.nasa.gov/multimedia/imagegallery

Contact Information

  • Project Website

– www.senecalakeplan.info

  • David Zorn

– Genesee/Finger Lakes Regional Planning Council

  • Chelsea Robertson

– Southern Tier Central Regional Planning and Development Board

  • John Halfman & Sarah Meyer

– Finger Lakes Institute, Hobart & William Smith Colleges

  • Project Advisory Committee