
SLIDE 1
1
Self-similar traffic 1 Self-similarity 2 Aggregate traffic - - - PowerPoint PPT Presentation
Self-similar traffic 1 Self-similarity 2 Aggregate traffic - exact self-similarity Intuition: self-similar processes look the same at all (i.e., over a wide range of) time scales Def.: A stationary process X = (X k : k > 1) is called
1
2
3
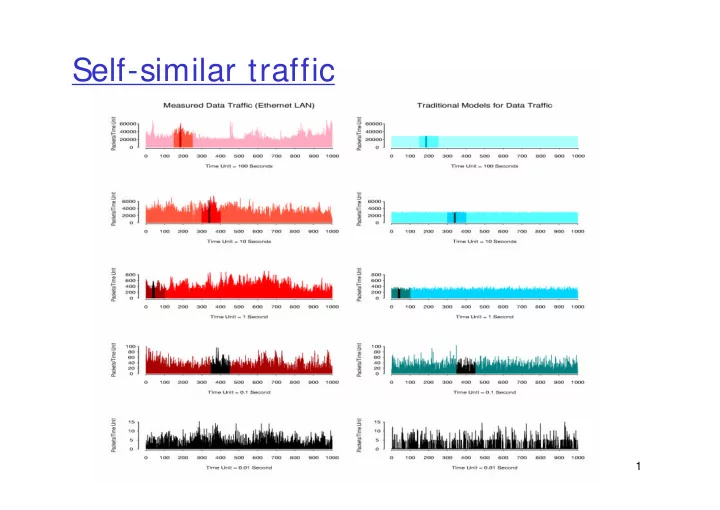
Intuition: self-similar processes “look the same” at all (i.e., over a wide range of) time scales Def.: A stationary process X = (Xk : k > 1) is called exactly self-similar (with self-similarity parameter H, 0 < H < 1), if for all m > 1, [LTWW94] LAN traffic is consistent with exact self-similarity
4
5
6
7
8
9
10
11
12
13
14
15
16
Short range dependence = finite correlation length Fluctuations over narrow range of time scales Plotting var(X(m)) vs. m on log-log scale shows linear
relationship for large m, with slope –1
17
18
Examples: Exponential, Normal, Poisson, Binomial Key features:
F has limited variability F is tightly concentrated around its mean F has finite moments P[X > x] vs. x on log-linear scale is linear for large x
19
Light-tails imply limited variability in space
SRD implies limited variability over time
Limited burstiness (in time and space)
20
Infinite correlation length Fluctuations over all time scales No characteristic time scale
21
−
H m 2 2 ) (
22
X random variable with distribution function F F is said to be heavy-tailed if there exists c > 0 Important features:
1 < α < 2, X has finite mean but infinite variance Heavy-tailed implies high variability Tail decays like a power, hence power-law dist. Plotting P[X > x] vs. x on log-log scale is linear for large x with slope α
23
24
25
26
27
28
29
30
31
32
33
Network? User behavior?
Examine characteristics of individual src-dst pairs Clustering of packets between src-dst pairs Define clusters as ON/OFF periods Distribution of ON/OFF periods
34
35
36
37
Application-level: single transfer web server to client Host-level: multiple transfers from server to client Subnet-level: multiple transfers to a group of clients
60-second spacing between consecutive packets
38
39
40
Superposition of independent ON/OFF sources is self- similar, if durations of periods are heavy-tailed with infinite variance
Users are ON/OFF ON periods are heavy-tailed (file sizes) OFF periods are heavy-tailed (think times) Distributions of ON/OFF-periods show heavy tails
with infinite variance
41
42
How are WANs different from LANs
Network effects matter: roundtrip delays, queuing, flow control Many more source destination pairs (not continuously active)
WAN traffic is not exactly self-similar [PF95, FGWK98]
Generalize notion of self-similarity Examine nature of traffic at application/connection layer Beyond self-similarity (where are the network effects)
43
Asymptotic self-similarity is equivalent to long-range
dependence of infinite correlation length
Asymptotic self-similarity does not specify the small-time
scale behavior of a process
44
Poisson session arrivals Session durations or session sizes are heavy tailed with
infinite variance (i.e., 1 < = alpha < 2)
Traffic within session is generated at constant rate The resulting process is (asymptotically second-order)
self-similar with self-similarity parameter
45
Extract session-level information from WAN traces Test if arrivals are consistent with Poisson Test if arrivals are consistent with independence
46
47
48
49
50
51
52
LAN:
Superposition of independent ON/OFF sources ON/OFF periods are heavy-tailed with infinite variance
Packets per unit time is exactly self-similar WAN:
Sessions arriving in a Poisson manner sizes (# packets) are heavy-tailed with infinite variance
Packets per unit time is asymptotically self-similar
53
Before Web (1994): Self-similarity at packets per time unit
Poisson arrivals at application layer (FTP, Telnet) Heavy-tailed session durations/sizes
Since Web (1995)????
Arrivals of User session # of Web requests per session
54
Modified Web browser (Mosaic) Population: students at BU Duration: 21 Nov 94 to 8 May 95
Sessions 4,700 Users 591 URLs Requested 575,775 Files Transferred 130,140 Unique Files Requested 46,830 Bytes Requested 2,713 MB Bytes Transferred 1,849 MB Unique Bytes Requested 1,088 MB
55
56
57
58
59
60
Web page TCP 1 TCP 2 TCP 3 TCP 4 HTTP Request 1 HTTP Request 2 HTTP Request 3 HTTP Request 4 HTTP Request 4 Users ….
61
62
63
Before Web (1994): Self-similarity at packets per time unit
Poisson arrivals at application layer (FTP, Telnet) Heavy-tailed session durations/sizes
Since Web (1995): Self-similarity at # of TCP connections per time unit
Poisson arrivals of User session (modem session) Heavy-tailed # of TCP connections per session