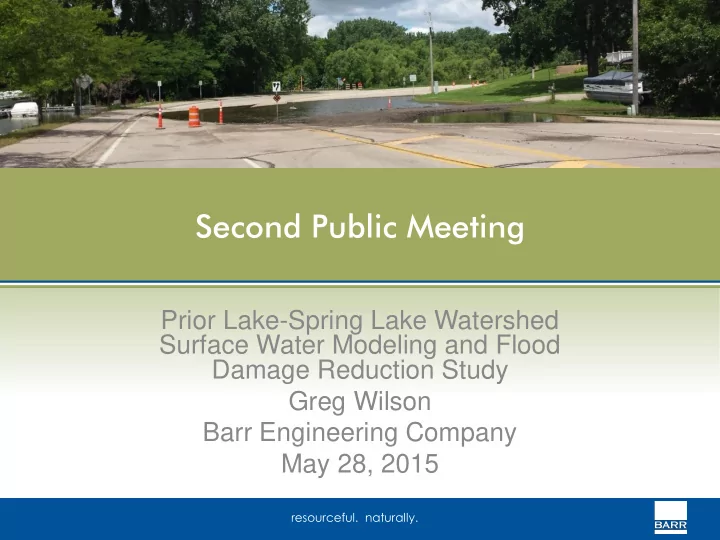

Second Public Meeting Prior Lake-Spring Lake Watershed Surface Water Modeling and Flood Damage Reduction Study Greg Wilson Barr Engineering Company May 28, 2015 resourceful. naturally.
Meeting Outline • Project Update – Summarize major themes from the first public meeting – Recap 2014 monitoring • Preliminary Modeling and Universe of Options – Overview of model calibration to 2014 flooding – Preliminary results of 100-year flood event resourceful. naturally. 2
Themes from First Community Meeting • How were you impacted by 2014 flood? – Damage to structure, shoreline, lawn/yard – Sandbagging and pumping for extended period – Road closures, loss of recreational use • What issues, concerns, possible remedies would you like considered? – Upstream storage and management of flow* – Modification to outlets/outlet operation – Water quality concerns – Flood-proof homes and use other storage basins resourceful. naturally. 3
Themes from First Community Meeting • For you, the most important outcome of this study would be… – Better management of lake levels; never let water to get to 904.5’ – More proactive flood response; estimate each spring if Prior Lake is going to flood – Slow down upstream water/manage inflows – Improving/protecting long-term water quality – Don’t exacerbate downstream (of PLO) impacts resourceful. naturally. 4
Themes from First Community Meeting • Other comments/suggested strategies – Flood-proofing/buyouts – Enlarge Prior Lake outlet channel or provide new pipe – Re-establish overflow under TH13 – Emergency pumping to Campbell Lake/other basins – Let water out of PLO sooner — 901 feet MSL or permanently/temporarily lower control elevation – Control Spring Lake outlet/permanent dam – Upstream storage (Buck Lake and CD13) resourceful. naturally. 5
Results of 2014 Monitoring — Spring Lake 913.5 0 Crest: 913.3 913 Crest Crest of f 913.3 .3 on 1 June 21, , 2014 912.5 912 2 Spring Lake No-Wake Restrictions 911.5 Lake Level (ft) Spring Lake Outlet Rainfall (in) Channel Dam In Place 911 3 910.5 4 910 909.5 5 5" rainfall 909 908.5 6 May-01 May-16 May-31 Jun-15 Jun-30 Jul-15 Jul-30 Aug-14 Aug-29 Sep-13 Sep-28 Daily Rainfall Spring Lake Elevation No-Wake Level (904.0) resourceful. naturally. 7
Results of 2014 Monitoring — Prior Lake 906.5 0 Crest: 906.17 Crest of Crest f 906.2 .2 on June 30, , 2014 905.5 1 904.5 2 Daily Rainfall (in) Lake Level (ft) 903.5 3 Outlet Structure Discharging 902.5 4 (above 902.5) 901.5 5 5" rainfall 900.5 6 May-01 May-16 May-31 Jun-15 Jun-30 Jul-15 Jul-30 Aug-14 Aug-29 Sep-13 Sep-28 Daily Rainfall Prior Lake Elevation No-Wake Level (904.0) (NWS Chanhassen) resourceful. naturally. 8
Watershed Map resourceful. naturally. 9
Results of 2014 Monitoring resourceful. naturally. 10
Results of 2014 Monitoring resourceful. naturally. 11
Results of 2014 Monitoring Provide more Storage, Slow the Flow Increase outflow rate resourceful. naturally. 12
Calibration to 2014 Event Prior Lake Elevation resourceful. naturally.
Calibration to 2014 Event Spring Lake Elevation resourceful. naturally.
“What - if” Mitigation Strategies used in Modeling Scenarios • Increase upper watershed storage – Utilized 1,000 ac-ft. storage by restricting flow at 3 locations • Increase Spring Lake storage – Raised peak elevation by 1.2 ft. to 915.1’ – Raised peak elevation by 2.0 ft to 915.9’ • Modify Prior Lake outlet structure – Increase flow to 65 cfs (and 85 cfs) when lake level is > 902.5’ • Combination of three scenarios (upper watershed storage, Spring at 914.3’ & 85 cfs from Prior Lake) resourceful. naturally. 18
“What - if” Modeling Results for Mitigation Strategies resourceful. naturally. 19
“What - if” Modeling Results for Mitigation Strategies resourceful. naturally. 20
“What - if” Modeling Results for Mitigation Strategies resourceful. naturally. 21
“What - if” Modeling Results for Mitigation Strategies resourceful. naturally. 22
Selection Matrix for Flood Mitigation Options • Criteria that will be summarized for each alternative: – Life-cycle costs — incl. construction, O&M, loss of property use/value – Benefit — measured by flood peak reduction – Other benefits or impacts — water quality improvement(s), wetlands, habitat, etc. – Feasibility of reduction mechanisms — legal authority, regulatory controls, education, eligibility for outside funding, readiness resourceful. naturally. 23
Questions?? resourceful. naturally. 24
Recommend
More recommend