SLIDE 1
SEC Applied Project Final Report 7/10/2018: Solar-Powered Temperature Control for Military Housing in the Middle East By: Jared Falls
Faculty Advisor: Steven Trimble Industry Advisor: Jeff Wishart
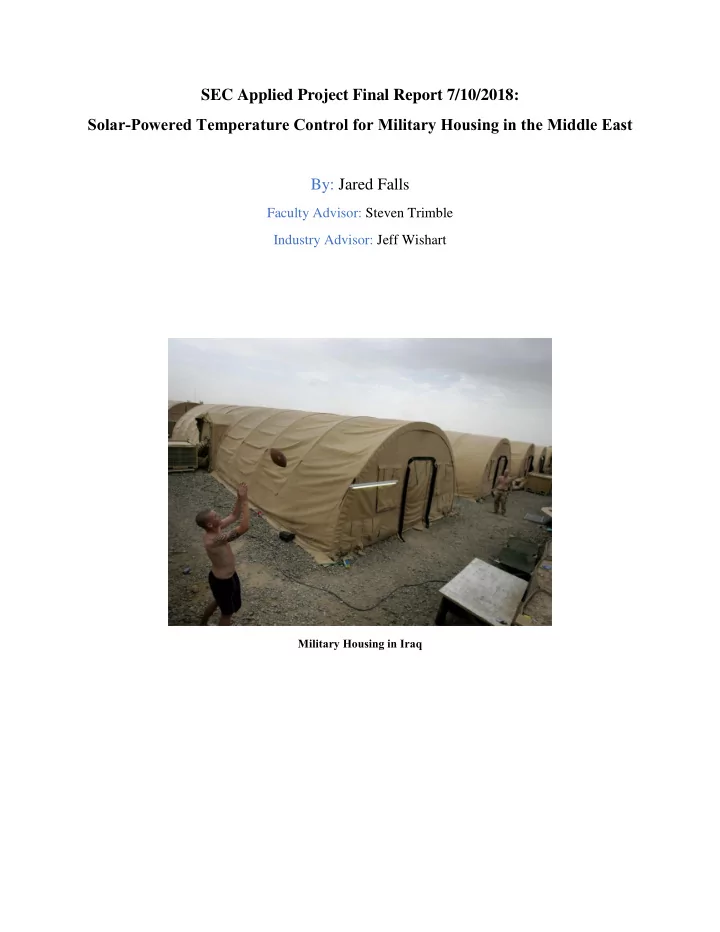
Military Housing in Iraq
SLIDE 2 Abstract: Currently, installation of electrical power for remote military housing installations is provided by Generators operating on diesel oil due to transportation and handling costs. The use of a PV/ESS (Energy Storage System) system is investigated as an option for reducing overall life cycle cost, and a reduction of the number of casualties experienced during fuel transports. Based on data from Iraq installations, an enhancement algorithm based on life cycle costs was developed. This algorithm can be used to increase the cost and efficiency of the proposed system. The scope of the project was limited to evaluating only a simplified set of assumptions. This bounding analysis indicates that the proposed PV/ESS system offers the potential for large cost savings. A go- forward plan for further refining research is included. The Applied Project report provides all the assumptions made throughout the process, along with heat transfer equations, load curves, and Insolation curves, all of which would be used to optimize the cost of the system over a project life
SLIDE 3 Acknowledgements: Firstly, I would like to thank Karen Dada for steering me towards the ASU Solar Energy Engineering and Commercialization program, a program I did not know existed prior to her reaching out to me via e-mail late last year. I would like to thank both of my advisors, Dr. Steve Trimble and Dr. Jeffrey Wishart for their relentless dedication and expert guidance throughout the duration of my Applied Project. They both did an extraordinary job assisting me in completing a project that remained within the time constraints and scope of the Applied Project for the PSM
- program. I would like to thank Dr. Ronald Roedel for his guidance and his friendship throughout
the entirety of the PSM program. Additionally, I would like to thank my Uncle and his family for graciously housing me for two full years free of charge upon my arrival to Arizona. I would also like to thank Christine Kelly for her support and her recommendations regarding the crux of my analysis and my Defense presentation. Lastly, I would like to thank both of my parents and everything they have done for me: mentally, physically, emotionally, and financially over the years, and particularly in the years I struggled, early on in my college career. It’s easy to stand behind someone when the road to success is smoothly paved and accomplishments are easily
- attained. However, it takes a lot of courage and loyalty to stand behind, and support someone, even
their own child, when they’re at their lowest, during trial and tribulation. Through the good and the bad, the trouble and the triumph, my parents have always stood behind me. This is a testament to their character and their loyalty, and I am eternally grateful to them, and everybody else who has helped me become the man I am today.
SLIDE 4 Table of Contents:
1.1 Description of Industry Issue 1.2 Problem Statement 1.3 Solution Requirements 1.4 Project Limitations 1.5 Report Organization
- 2. Background Information
- 3. Baseline Project Plan
3.1 Original Approach 3.2 Original Planned Project Schedule 3.3 Original Tasks Planned/Approach 3.4 Original Labor and Materials Budget 3.5 Five Success Factors for Applied Project 3.6 Making the Project Plan a Living Document
- 4. Project Implementation
4.1 Phase 4 Initial Work Completed 4.1.1 Final Schedule and Labor Loading Budgets 4.1.2 Solution Space Exploration, Identification of Candidates and Final Selection 4.1.3 Algorithm Architecture and Sample Case Definition 4.2 Phase 5 Major Work Completed 4.2.1 System Block Diagram 4.2.2 Sample Case for Sizing PV System/ESS for Remote Military Housing 4.2.3 Determining Total Thermal Heat Load Required for Military Housing 4.2.4 Determining Total Electrical Load Requirements 4.2.5 Sizing of the PV System for Electrical Demand 4.2.6 Sizing the Energy Storage System for the PV System 4.2.7 Selection of Thermal Management System (TMS)
SLIDE 5 4.2.8 Financial Analysis of Hybrid PV/ESS System vs. Generator System 4.3 Optimization Algorithm for Design 4.4 Phase 6: Final Work
- 5. Conclusions
- 6. Recommendations
- 7. Project Evaluation
- 8. Lessons Learned
- 9. References
- 10. Appendices
SLIDE 6 Solar-Powered Temperature Control for Military Housing in the Middle East
The project that has been chosen for the Applied Project, is the design of an off-grid, indoor temperature control system for military housing in the Middle East. The project incorporates a photovoltaic (PV) system with an energy storage system (ESS), and combine it with a heating, ventilation, and air conditioning (HVAC) system that controls the indoor temperature. A Thermal Management System (TMS) is then used in order to control the temperature of the ESS. Additionally, a Generator is used in the system as a source of backup power in the summer, as well as low Insolation days, unforeseen inclement weather, etc. 1.1 Description of the Industry Issue This project seeks to address the problem of the U.S. military’s reliance on foreign energy sources, and seeks to reduce the cost and danger of fuel transportation via the use of a PV system integrated with HVAC units in remote military camps. This project also seeks to demonstrate how a PV system can work in tandem with an ESS and HVAC system to provide indoor temperature control, specifically for military housing in remote areas, where access to grid electricity is scarce to non-
- existent. The project also provides an economic analysis on the addition of the PV system to the
existing HVAC system. The industry that this project involves is primarily the defense industry and specifically, the Department of Defense. The selected project has the potential to save the United States Department of Defense (DoD) a significant amount of money on fuel transportation costs and save lives by reducing the number of convoys devoted to fuel delivery. 1.2 Problem Statement The United States Armed Forces need affordable energy sources to supply them with electricity in remote parts of the world. The selected project proposes the use of renewable energy, and particularly, solar energy in order to supply the necessary energy for indoor temperature control
- f military housing in the Middle East. The utilization of solar energy is environmentally friendly,
as well as economically feasible, as fuel transportation costs for the DoD are significant. While there are transportation costs involved for the PV system and ESS installation, these are one-time events, and do not require multiple transports. 1.3 Solution Requirements The requirements derived from the aforementioned problem statement are listed below: (1) Determine required heat load for the 16’ x 32’ spray-foam insulated military housing [1]
- Size of housing, Indoor conditions
SLIDE 7 (2) Determine the total electrical demand required for the military housing (3) Provide an algorithm that can be used to optimize the size of PV and ESS used in the system in terms of financial cost and feasibility. (4) Design a PV system and ESS pair using load analysis for remote military housing. (5) Provide an economic analysis of the PV/ESS/HVAC system versus an HVAC system solely operating with a Generator over a given project life Shown below, is the project schedule, as required per the Applied Project Handbook. Each phase is chronicled in the figure, with key milestones included.
Figure 1: Project Schedule for Applied Project [17]
1.4 Specific Project Limitations There were a number of limitations to this Applied Project for a variety of reasons. The scope of the project was scoped for the creation of an algorithm that would provide a model for the
- ptimization of a PV-powered HVAC system with an ESS and a back-up Generator. The analysis
performed was based on some simplified assumptions that are listed in Section 4. This simplification of analysis was brought about by time constraints, and an attempt to remain close to the 175 hours of allotted time for the Applied Project. [17] Data acquisition proved to be much more difficult than originally projected. Additionally, the following characteristics and properties would need to be taken into account in order to perform a complete optimization of the system: (1) Yearly Insolation and temperature data on an hourly level for the desired location, Baghdad, Iraq Insolation and temperature data for a typical year.
SLIDE 8 (2) The efficiency of the PV modules is a function of temperature, and not one constant value. (3) The precise production period for the PV modules must be known for each day of the year. (4) Efficiency and losses for specific inverter types and wiring would need to be accounted for. (5) The exact lifespan of the project would have to be known in order to accurately calculate the Life-Cycle Cost (LCC) of the system and compare it to the LCC of the existing system. (6) The actual Coefficient of Performance (COP) value of the HVAC system in use would be required in converting thermal heat load to electrical energy. (7) The radiative heat transfer to the walls of the military housing should be considered. (8) Operation and Maintenance costs for the PV, ESS, Generator, and HVAC systems should be considered. (9) Effect of Insolation and other variables on PV and ESS cost per kW/kWh should be investigated. (10) The exact amount of electrical demand that the HVAC system contributes to should be considered rather than estimated. (11) The exact cost of the Generator used in the system should be considered, based on the size and the output of the Generator. (12) The Thermal Management System (TMS) and its materials should be considered in the
- ptimization of the design, as well as the specific cost of the materials.
(13) Choice of specific ESS should be made that is most effective for the given system. i.e. Different chemistries should be studied and considered (14) A communications system between the ESS and the TMS should be implemented in order to control the temperature of the ESS. (15) The Depth of Discharge (DoD) range of the selected ESS should be known and implemented, along with the Round-Trip efficiency. 1.5 Report Organization The Applied Project report is divided into 10 distinct sections. Introduction, Background Information, Baseline Project Plan, Project Implementation, Conclusions, Recommendations, Project Evaluation, Lessons Learned, References, and Appendices. The Introduction section (1) gives a brief overview of the project, with a problem statement, the requirements, and the
- limitations. The Background Information section (2) of the report provides insight into the
potential customer of the product and rationale on why research into the chosen topic is relevant. The Baseline Project Plan (3) provides the original project plan, schedules, and labor loading
- budgets. The Project Implementation section (4) contains most of the analysis in the report, as well
as an optimization algorithm to be used by future researchers in order to obtain more accurate
- results. The Conclusions section (5) provides a summary of the results determined in section 4.
The Recommendations section (6) of the report contains suggestions to future researchers, including improving upon all the assumptions made in the analysis portion of this Applied Project. The Project Evaluation section (7) provides an analysis on how well the project was managed, and examines some of the alterations to the project and scope over time. The Lessons Learned section (8) of the report provides all the knowledge gained by the student throughout the duration of the
SLIDE 9
Applied Project. The References section (9) contains all the references used in the report, and the Appendices section (10) contains any pertinent information and programming code used for Applied Project purposes.
SLIDE 10
- 2. Background Information
The United States DoD is one of the largest investors in solar energy in the world. For years, the DoD has been committed to investing in renewable energy sources, and more than 50% of its added renewable energy production capacity since 2012 has been solar energy systems. [16] This accounts for approximately 638 MW of power production solely from PV systems. [16] Additionally, the cost for transportation of fuel is exceedingly high, as for each gallon of fuel used by a Generator, it costs seven gallons of fuel to transport it there, according to the US Army Corps
- f Engineers. [1] Thus, a proposed PV/ESS/HVAC edition to the existing system was explored.
The block diagrams of the existing system, and the proposed system are shown below.
Figure 2: Block Diagram of Existing System
The new system designed in this Applied Project includes a PV system, an ESS, and a TMS in
- rder to regulate the temperature of the ESS. The block diagram for the proposed system is shown
below in Figure 2. All proposed changes to the system will be analyzed in the Project Implementation section of the report.
Figure 3: Block Diagram of PV-Integrated System
ESS
SLIDE 11
The spray-foam insulated tents used by the US military in Iraq are shown in Figure 3. The PV modules used for this study are made by SunPower and are described in Figure 4.
Figure 4: Spray-Foam Insulated Tents in Middle East [1]
Shown below, are the modules that were selected for analysis purposes for this project. They are SunPower modules, rated at 350 W, at optimal conditions of 1000 W/m2 and 25o C. They have a module area of approximately 1.5 m2 (1 m x 1.5 m). [6] These modules were selected because of a relatively high rated efficiency for the given power rating (approximately 23.3%). Therefore, the assumption of 20% module efficiency used in the analysis section of this report is a conservative estimate, that could actually include inverter and wire losses with the extra 3.3 % The PV module efficiency of the SunPower modules calculation is shown below. 𝜃𝑞𝑤,𝑏𝑑𝑢𝑣𝑏𝑚 = 𝑄𝑊
𝑠𝑏𝑢𝑗𝑜
𝐵𝑞𝑤 ∗ 𝐻𝑠𝑏𝑢𝑓 ∗ 100% where, 𝑄𝑊
𝑠𝑏𝑢𝑗𝑜 = Module rating = 350 W
𝐵𝑞𝑤 = Area of one PV module = 1.5 m2 𝐻𝑠𝑏𝑢𝑓 = Insolation condition for module rating = 1000 W/m2 𝜃𝑞𝑤,𝑏𝑑𝑢𝑣𝑏𝑚 = 350 𝑋 1.5 𝑛2 ∗ (1000 𝑋 𝑛2) ∗ 100% 𝜽𝒒𝒘,𝒃𝒅𝒖𝒗𝒃𝒎 = 𝟑𝟒. 𝟒%
SLIDE 12 Figure 5: SunPower Modules Selected for Applied Project [6]
Table 1 provides the temperature data used in order to calculate the thermal heat load required to keep the spray-foam insulated tent at a desired temperature for each season (70oF, and 75oF, for Summer and Winter, respectively), considering the effects of convective and conductive heat transfer. Table 1: Average weather data for Baghdad, Iraq [18] Month Maximum (oF) Average (oF) Minimum (oF) January 66 49 32 February 78 51 26 March 82 63 44 April 100 73 51 May 109 85 62 June 120 93 69 July 122 101 78 August 120 99 77 September 118 93 68 October 98 78 53 November 87 65 42 December 77 57 35 Analysis: From the average weather data obtained from Baghdad, it can be deduced that the hottest day in Iraq occurs, on average, in July, at 122oF. Additionally, the highest average temperature in Baghdad also occurs in July. The lowest temperatures in Baghdad appear to occur in January and
- February. In order to make the analysis reasonable, average days from each season have been
selected in order to perform analysis. The temperature ranges for these average days are provided in section 4 of the report, where the analysis is conducted. Any outlying days that require more electrical demand than the PV system can provide will be supplied by the backup Generator. Shown below, is a typical stand-alone configuration of a stand-alone PV system with energy
SLIDE 13
storage, however, for my analysis, the block diagram shown above will be used for simplified analysis, and the inverter is not necessary as my load will be DC. Shown in Figure 6 is a typical configuration of a stand-alone PV system with energy storage. Note that the simplified analysis in this report uses the block diagram shown in Figure 3 where an inverter has not been included. An inverter should be included in future evaluations.
Figure 6: Typical Stand-Alone PV System with ESS [20]
SLIDE 14
- 3. Phase 3 Baseline Project Plan
3.1 Project Goals and Limitations The Solar Engineering and Commercialization Master’s Degree requires the Applied Project to address an industry problem and provide a solution incorporating solar energy equipment. The goals of the project are to (1) use the knowledge learned during the program to solve an industry problem and (2) manage the project to complete on-time and within the labor budget. The project starts during the first semester of the program and must be completed by the first week in the following August. The project is limited to about 175 hours of the student’s time. The student must follow the phased process provided in the Applied Project Handbook. The student must scope the project to meet these limitations. 3.2 Project Development Process Shown below, is the Applied Project schedule, per the Applied Project Handbook. The Handbook includes 7 phases, along with reviews with advisors, and a “Shark Tank” presentation that involves feedback from the PSM Industrial Advisory Committee. Each phase of the project has “Exit Criteria” that must be completed before the student can begin the next phase of the project. For this reason, the phases do not run concurrently on the Applied Project schedule. The head of the Applied Project, Dr. Steven Trimble must sign off on each student’s workbook to ensure that the have met the requisite conditions to move to the next phase.
Figure 7: Project Schedule by Phases [17]
SLIDE 15 3.3 Baseline Approach The baseline project plan was developed during the first semester of the project. It is a living document that was updated during the course of the project. The original project schedule is shown Figure 8.
Figure 8: Original Project Schedule
This project schedule changed throughout the course of the semester due to changes in scope. The
- riginal plan of using solely a PV system to power an HVAC system in the Middle East for military
housing became non-feasible, when considering the possibility of low Insolation days and storms. The ESS needed to account for these unforeseen consequences would be significantly large. Therefore, a Generator was included in the design process to supply backup power to the housing. The scope of designing the system for Alaska was also eliminated from the project schedule. 3.4 Original Tasks Planned/Approach The original planned tasks for the project included the following: (1) Gathering weather data for Iraq, with which to calculate heating loads and availability of Insolation for the PV system. (2) Determining the dimensions of the military housing in order to properly calculate the amount of heat transfer energy needed in order to provide the housing with the requisite energy to keep it at a consistent 75oF, while also supplying enough extra energy for other electrical demands, such as electronic devices and appliances. The military housing is 16’ x 32’ and is insulated by 1.75” foam. (3) Design of PV and ESS systems to meet the electrical demands of the foam-insulated military housing. A big portion of this task is showing the process of incorporating a PV system with an HVAC and Generator system set in order to reduce cost of fuel and electricity.
SLIDE 16 (4) Selection of HVAC components. This process is not covered extensively during the project due to time constraints. (5) Analysis of system design. This important task was critical to the project, as the process of analysis shows how a PV system ESS, and TMS can be sized and incorporated into an HVAC system, and a comparison can be made between current systems, and the designed system. 3.5 Original Labor and Material Budgets Depicted below (see Figure 9), are the projected hours spent working on the Applied Project throughout the 11-month duration of the Solar Energy Engineering and Commercialization
- program. Note that May is the peak labor month since the spring semester courses are complete
and a major part of the analysis is required during this time.
Figure 9: Projected Labor Loading Budgets for the Applied Project
3.6 Five Success Factors for the Applied Project Listed below, are the five main factors that contribute to this Applied Project being successful. These factors were determined with the guidance of the advisory committee. (1) Expert guidance from advisors (2) Allowance for contingencies (3) Providing an algorithm based on analysis to support the benefits of adding a PV system to an existing HVAC system with a Generator used for power. (4) Self-motivation and passion for the topic (5) Concentration on a specific application of this project
SLIDE 17
- 4. Project Implementation
4.1 Phase 4 Initial Work Completed During Phase 4, the background data was collected (See Section 2). An analysis of this data resulted in a re-scoping of the project to meet the 175-hour project limitation. Emphasis was focused on the creation of the optimization algorithm. There were not enough labor hours available to fully optimize the size of the PV/ESS/Generator system. This task is left for further research. A simplified set of data for solar Insolation and electrical demand were used to verify that the algorithm works. This initial study also served as a bounding analysis to show that for an
- ptimistic set of conditions the proposed system has the potential for cost savings.
The actual project consisted of tasks that were slightly different than the tasks that were originally planned in the Project Proposal. The list of actual tasks to be completed, after the change in scope are shown below: (1) Determine thermal load required for military housing (2) Determine total electrical load for the military housing from thermal load (3) Design of PV system for required electrical load (4) Size ESS for required for maximum and minimum PV system energy output (5) Determine materials for ESS (TMS), and associated costs of the materials (6) Conduct a financial analysis between the two systems over an assumed project life and compare the results, using the LCC approach 4.1.1 Final Schedule and Labor Loading Budgets Figure 10 shows the completed schedule for the project. Figures 11 and 12 show the actual hours spent versus the original labor budget. Gathering data early in the project and deciding on a design approach took more time than originally planned. Even with the re-scoping of the project to use
- nly a simple evaluation case, the project took around 210 hours versus the desired 175 hours.
Figure 10: Final Project Schedule
SLIDE 18 Analysis: From the schedule above, it can be deduced that the final project schedule contains some alterations since the conception of the Project Proposal. There are several reasons for this deviation, which will be discussed in later sections of the paper. The monthly and cumulative labor budget hours completed during the project are shown in the figures below.
Figure 11: Actual Monthly Labor Budget Figure 12: Actual Cumulative Labor Budget
Analysis: It can be deduced from the figures above, that the month-to-month hours worked on the Applied Project was more volatile than desired. However, the cumulative labor budget was relatively similar to the hours allotted for the Applied Project, with the total hours being slightly greater than the 175 hours projected (211 hours total). These extra hours were mainly due to changes in scope, and refinement of the deign process for the Applied Project. June and July were hectic months, however, the advisors helped to formulate a plan for success that would allow for a complete project worthy of being deemed an Applied Project, while also curbing student cumulative hours below 225 hours (50 extra hours). 4.1.2 Solution Space Exploration and Identification of Candidates A few different solutions were devised for meeting the problem statement requirements that were agreed upon, and then carefully analyzed the pros and cons of each. This part of the process was very significant in narrowing the scope of the project, such that it could be completed in the allotted time given for the Applied Project. Some of the original options are listed below:
- 1. PV system only w/no ESS + generator for military housing electrical demand (ED)
- 2. Portable PV+ ESS system for military housing ED
- 3. PV system + ESS+ generator system for military housing ED
All of these candidate solutions were explored, and a thorough literature review was performed to select an Applied Project topic that would best meet the following criteria:
SLIDE 19
- Most beneficial to the Industry and user (US Military)
- Relevant to the course of study
- Within the scope/timeframe allotted for the Applied Project
- Within the student’s skill set
Thus, option (3) was ultimately selected because of the multi-faceted engineering principles
- involved. Additionally, the decision was made to create an algorithm that could be used to optimize
the design of the PV/ESS system for remote military housing that can be used by future researchers. 4.1.3 Final Solution Approach Selection Process In selecting the final solution to the problem statement, the advisory committee considered analysis that would provide the audience a thorough process with which a future researcher could use to
- ptimize the design of the PV/ESS system for remote applications. The algorithm architecture is
to follow the following rules:
- If the electrical demand is less than the PV electrical output and the ESS is fully charged,
then the PV system is open circuit and the solar energy is wasted.
- If the electrical demand is greater than the PV electrical output, then the power is taken
from the ESS unless it is fully discharged.
- If the electrical demand is greater than the PV electrical output and the ESS is fully
discharged, then the Generator is started, and fuel is converted to electrical energy to meet the load for that hour.
- The ESS starts with enough energy to meet two peak summer day electrical energy
demands assuming no sunlight is present.
- The ESS round trip efficiency is assumed to be constant.
- The Generator efficiency is assumed to be constant.
The final algorithm is discussed in Section 4.,2. The scope of this project is limited to using the algorithm to evaluate a simplified case with the following assumed, average conditions:
- Winter is 6 months long, with 12 hours per day of 600 W/m2 solar input
- Winter electrical demand is a constant value (calculated from heat loads)
- Summer is 6 months long with 12 hours per day of 800 W/m2 solar input
- Summer electrical demand is a constant value (calculated from heat loads)
- The ESS is initially charged with enough energy to meet two days of summer electrical
demand without any PV input. 4.2 Phase 5 Major Work Completed The major work of the Applied Project was the creation of an algorithm for comparing the proposed PV/ESS/Generator system versus the current Generator system for meeting the electrical loads associated with a 10-person military tent located in Baghdad, Iraq. The new
SLIDE 20 PV/ESS/Generator system was optimized for the lowest life cycle cost over a 12-year operating period. The assumptions implemented in the analysis of my Applied Project are listed below. Some of these assumptions were made based on literature values, and some of the assumptions were determined based on engineering judgement and simplification of analysis. 4.2.1 System Block Diagram Shown below, is the block diagram of the PV/ESS/Generator system that is to be analyzed in the following sections of the report. The critical components of the modified system are the addition
- f the PV system, the ESS, and the Thermal Management System (TMS).
Figure 13: Block Diagram of PV/ESS-Integrated System
ESS
SLIDE 21
4.2.2 Sample Case for Sizing PV System/ESS for Remote Military Housing Rather than start with a detailed generalized LCC algorithm, a simplified case was initiated. This simplified case is presented in this section. The more generalized algorithm is discussed in Section 4.3. The algorithm for the simple case study is shown in Figure 14. Process A leads to the LCC of the current method of only using a Generator. Process B leads to the LCC of the proposed PV/ESS/Generator method. It should be noted that one starts with Process A. Once the electrical demand is found, the process branches. One branch continues to complete Process A. The other branch goes to Process B. This algorithm was not used to optimize the system. Rather, it was used to evaluate a set of simplifying conditions. The solar insolation and heat loads are assumed, and the required number of PV modules and ESS capacity were determined. This information was then used to estimate the LCC.
Figure 14: Modified Algorithm for Designing PV/ESS System
The assumptions made while employing this algorithm are listed below. Assumptions: (1) HVAC system is 75% of electrical load (per US Army Corps of Engineers) [1] (2) Military housing dimensions are 16’ x 32’: Area = 512 ft2 = 47.6 m2, 10 personnel [1]
SLIDE 22
(3) COP of HVAC system is 2: COP = 2 (Typical COP value for low power HVAC system) (4) PV system produces for 12 hours/day for summer and winter (5) PV module efficiency = 20% [3] (6) Generator fuel cost: $5/gallon (7) For every gallon of fuel used, it costs seven to transport it to military base ($40/gallon) [1] (8) Generator Capital Cost is $600/kWe [19] (9) Average Insolation for Baghdad, Iraq in summer = 800 W/m2 (10) Average Insolation for Baghdad, Iraq in winter = 600 W/m2 (11) Project Life = 12 years (12) PV module are = 1.5 m2 per module [6] (13) No maintenance costs for PV system or Generator over 12-year project life. (14) Desired temperature for winter: Ti,w = 70o F (15) Desired Temperature for Summer = Ti,s = 75o F (16) PV system cost = $2750/kW [8] (17) ESS system cost = $500/kWh [9] (18) TMS system materials cost = $288 (up-front cost) [14] (19) ESS round-trip efficiency = 98% [10] (20) ESS Depth of discharge (DOD) = 80% 4.2.3 Determining Total Thermal Heat Load Required for Military Housing For determining the required loads for the housing, meteorological data on a typical day in Winter and Summer for Iraq was acquired. Next, determining the amount of thermal energy necessary to cool the housing by employing heat the following heat transfer equations was employed: Load Requirement: Heat Transfer Equation: 𝑹 = 𝑽 ∗ 𝑩 ∗ ∆𝑼 where, U = Overall Heat Transfer Coefficient A = Area of housing ∆𝑈 = Temperature difference between ambient (Ta), and desired inside temperature (Ti) ∆𝑈 = 𝑈
𝑏 − 𝑈𝑗
Overall Heat Transfer coefficient: 𝟐 𝑽 = 𝟐 𝒊 + 𝒖 𝒍 where, h = convective heat transfer coefficient t = wall thickness k = thermal conductivity Upon making reasonable assumptions for some of the material properties, the amount of heat transfer required to heat or cool the inside of the housing to a desired temperature could then be calculated.
SLIDE 23
4.2.4 Determining Total Electrical Load Required for Military Housing The heat transfer equations provided load demand curves for the thermal energy required. To determine the electrical demand required, an assumed Coefficient of Performance (COP) value for the HVAC of approximately 2 was used. This conversion from thermal to electrical energy provides the day to day energy requirements, along with peak and average electrical loads for the system. In order to calculate the amount electrical output required by the PV system, the amount of energy in kWhe was used and the PV system was then sized based on the average electrical demand over 24 hours. The heat load curves are shown in Figure 15. The total electrical demand solar Insolation curves are shown in Figure 16.
Figure 15: Heat Load Profiles for Summer and Winter Figure 16: Average Electrical Demand and Average Insolation Curves by Season
It is important to note that the heat load profiles, average Insolation, and average electrical demand shown are for an average day in each season, and not an entire year’s worth of data. The low solar Insolation curve in Figure 16 is shown as an estimate for days where the backup Generator may be used to produce the extra electrical demand required by the military housing. The heat load data shown in Figure 15 was calculated by using the equation developed in Section 4.2.3 and the ambient temperatures given in Table 1 for Baghdad. The thermal heat loads (Qi) in Figure 15 are then used to determine the average daily heat load for both summer and winter as shown below. Total Heat Load Energy Demand: 𝑭𝒖𝒑𝒖𝒃𝒎,𝒖 = ∑ 𝑹𝒋
𝒋
∗ ( 𝟐 𝒍𝑿 𝟐𝟏𝟏𝟏 𝑿) ∗ (𝟐 𝒊𝒔 𝒎𝒑𝒃𝒆) Total Summer Heat Load Energy Demand:
SLIDE 24
𝑭𝒕,𝒖𝒑𝒖𝒃𝒎,𝒖 = 𝟔𝟗. 𝟑𝟏
𝒍𝑿𝒊𝒖 𝒆𝒃𝒛 (Integrated from Summer heat load curve)
Total Winter Heat Load Energy Demand: 𝑭𝒙,𝒖𝒑𝒖𝒃𝒎,𝒖 = 𝟓𝟖. 𝟕𝟔
𝒍𝑿𝒊𝒖 𝒆𝒃𝒛 (Integrated from Winter heat load curve)
These total daily energy values were then converted into average daily summer and winter heat load demand as shown below. Average Daily Summer Heat Load Power Requirement: 𝑸𝒕,𝒖𝒊𝒇𝒔𝒏𝒃𝒎 = 𝑭𝒕,𝒖𝒑𝒖𝒃𝒎,𝒖 (𝟑𝟓 𝒊𝒔𝒕) 𝑄
𝑡,𝑢ℎ𝑓𝑠𝑛𝑏𝑚 = (58.20 𝑙𝑋ℎ𝑢)/(24 ℎ𝑠𝑡)
𝑸𝒕,𝒖𝒊𝒇𝒔𝒏𝒃𝒎 = 𝟑. 𝟓𝟑𝟔 𝒍𝑿𝒖 However, to convert this thermal demand to electrical demand, the COP value of the HVAC system must be considered. The assumed COP value of the HVAC system is 2, and the equation for thermal to electrical power conversion is shown below: Average Daily Summer HVAC Electrical Demand: 𝑫𝑷𝑸 = 𝑹𝒑𝒗𝒖 𝑹𝒋𝒐 = 𝑹𝒖𝒊𝒇𝒔𝒏𝒃𝒎 𝑹𝒇𝒎𝒇𝒅𝒖𝒔𝒋𝒅 Where, 𝑅𝑢ℎ𝑓𝑠𝑛𝑏𝑚 = 𝑄
𝑡,𝑢ℎ𝑓𝑠𝑛𝑏𝑚 = 2.425 𝑙𝑋 𝑢
𝑅𝑓𝑚𝑓𝑑𝑢𝑠𝑗𝑑 = Average daily summer electrical demand for HVAC system 2 = 2.425 𝑙𝑋
𝑢
𝑅𝑓𝑚𝑓𝑑𝑢𝑠𝑗𝑑(𝑙𝑋
𝑓)
𝑹𝒇𝒎𝒇𝒅𝒖𝒔𝒋𝒅 = 𝟐. 𝟑𝟐𝟒 𝒍𝑿𝒇 = 𝑸𝒇,𝑰𝑾𝑩𝑫 (Summer) Considering that heat load is 75% of total electrical demand, the average electrical power needed in the winter can be determined by dividing the required HVAC load by the percentage of total electrical demand the HVAC system contributes to, which in this case, is 0.75 (75%). The average daily electrical demand for the military housing in the summer is given by the following equation: Average Daily Summer Electrical Demand: 𝑸𝒇,𝒕𝒗𝒏𝒏𝒇𝒔 =
(𝑸𝒇,𝑰𝑾𝑩𝑫) (𝟏.𝟖𝟔)
= (1.213 𝑙𝑋
𝑓)/(0.75)
𝑸𝒇,𝒕𝒗𝒏𝒏𝒇𝒔 = 𝟐. 𝟕𝟑 𝒍𝑿𝒇
SLIDE 25
For Winter: The required Heat Load Power needed to warm the military housing in the winter: Average Daily Winter Heat Load Power Requirement: 𝑸𝒙,𝒖𝒊𝒇𝒔𝒏𝒃𝒎 = 𝑭𝒙,𝒖𝒑𝒖𝒃𝒎,𝒖 (𝟑𝟓 𝒊𝒔𝒕) 𝑄
𝑥,𝑢ℎ𝑓𝑠𝑛𝑏𝑚 = (47.65 𝑙𝑋ℎ𝑢)
(24 ℎ𝑠𝑡) 𝑸𝒙,𝒖𝒊𝒇𝒔𝒏𝒃𝒎 = 𝟐. 𝟘𝟘 𝒍𝑿𝒖 However, when considering that the COP of the HVAC system is 2, and following the same process for the winter as in the summer: 𝑫𝑷𝑸 = 𝑹𝒑𝒗𝒖 𝑹𝒋𝒐 = 𝑹𝒖𝒊𝒇𝒔𝒏𝒃𝒎 𝑹𝒇𝒎𝒇𝒅𝒖𝒔𝒋𝒅 where, 𝑅𝑢ℎ𝑓𝑠𝑛𝑏𝑚 = 𝑄
𝑥,𝑢ℎ𝑓𝑠𝑛𝑏𝑚 = 1.99 𝑙𝑋 𝑢
So,
2 =
(1.99 𝑙𝑋
𝑢)
𝑅𝑓𝑚𝑓𝑑𝑢𝑠𝑗𝑑
𝑹𝒇𝒎𝒇𝒅𝒖𝒔𝒋𝒅 = 𝑸𝒇,𝒙𝒋𝒐𝒖𝒇𝒔 = 𝟐. 𝟏𝟏 𝒍𝑿𝒇 (𝑿𝒋𝒐𝒖𝒇𝒔) Considering that heat load is 75% of total electrical demand, the average electrical power needed in the winter can be determined by dividing the required HVAC load by the percentage of total electrical demand the HVAC system contributes to, which in this case, is 0.75 (75%): 𝑸𝒇,𝒙𝒋𝒐𝒖𝒇𝒔 = (𝟐. 𝟏𝟏 𝒍𝑿) (𝟏. 𝟖𝟔) = 𝟐. 𝟒𝟑𝟒 𝒍𝑿𝒇 4.2.5 Sizing of the PV System for Electrical Demand Using the average electrical demand for both the summer and the winter seasons, the PV system was sized for both the summer and the winter electrical demand, to determine which season was the limiting case for design. The equation used for calculating the number of PV modules for the system is shown below: Power Generated by the PV System: 𝑸𝒒𝒘 = 𝑯 ∗ 𝑩𝒒𝒘 ∗ 𝑶 ∗ 𝜽𝒒𝒘 [4] where, G = Average Insolation on Solar Panels
SLIDE 26
𝜃𝑞𝑤= efficiency of the PV modules N = # of modules needed Apv = Area of PV module = 1.5 m2 [6] Ppv = Electrical power demand requirement (avg. daily) Design for Winter PV system: 𝑸𝒒𝒘,𝒙𝒋𝒐𝒖𝒇𝒔 = 𝑯𝒙 ∗ 𝑩𝒒𝒘 ∗ 𝑶 ∗ 𝜽𝒒𝒘 [4] where, Gw = 600 W/m2 of Insolation in winter avg, constant 𝜃𝑞𝑤= 0.20 N = # of modules needed Apv = 1.5 m2 (per panel) [6] Ppv, winter = 1.323 kWe (Winter) Note: the PV system is only producing power for 12 hours a day. So, twice that amount is required to be produced by the PV system, in order to provide enough energy for the evening hours. 2*(1.323 kW) = 2.65 kWe = 2650 We is needed, in order to produce the requisite power needed to the housing, while also charging the ESS to produce the electrical demand during the evenings. (2650 𝑋 ) = (600 𝑋 𝑛2) ∗ (1.5𝑛2) ∗ (𝑂) ∗ (0.20) N = 15 Panels, A = 22.5 m2 Design for Summer PV system: 𝑸𝒒𝒘,𝒕𝒗𝒏𝒏𝒇𝒔 = 𝑯𝒕 ∗ 𝑩 ∗ 𝑶 ∗ 𝜽𝒒𝒘 where, Gs = 800 W/m2 of Insolation in Summer on avg., constant Demand from PV in Summer = 1.625 kWe on avg. during 12 hours of production. Thus, twice this amount of power needs to be produced during the day by the PV system in order to supply demand for the 12 evening hours. The power required is (1.625 kWe) *(2) = 3.25 kWe = 3250 We (3250 𝑋
𝑓) = (800 𝑋
𝑛2) ∗ (1.5 𝑛2) ∗ (𝑂) ∗ (0.20) 𝑶 = 𝟐𝟓 𝒒𝒃𝒐𝒇𝒎𝒕 A = 21 m2
SLIDE 27
From these calculations, it can be determined that Winter is the limiting factor in the design, requiring more solar panels to supply the electrical demand for the housing. Next, the power produced by this PV provide during the summer months was calculated, in order to size the ESS accordingly. 𝑸𝒒𝒘 𝒆𝒇𝒕𝒋𝒉𝒐,𝒕 = 𝑯𝒕 ∗ 𝑩 ∗ 𝑶 ∗ 𝜽𝒒𝒘 where, 𝐻𝑡 = 800
𝑋 𝑛2,
A = (1.5 m2) (per PV module) N = # PV modules 𝑄
𝑞𝑤,𝑡𝑣𝑛𝑛𝑓𝑠 = (800 𝑋
𝑛2) ∗ (1.5 𝑛2) ∗ (15) ∗ (0.20) 𝑸𝒒𝒘 𝒆𝒇𝒕𝒋𝒉𝒐,𝒕 = 𝟒. 𝟕 𝒍𝑿𝒇 > 𝟒, 𝟑𝟔𝑿𝒇 (3.25 𝑙𝑋
𝑓 𝑗𝑡 𝑢ℎ𝑓 𝑓𝑚𝑓𝑑𝑢𝑠𝑗𝑑𝑏𝑚 𝑒𝑓𝑛𝑏𝑜𝑒 𝑗𝑜 𝑇𝑣𝑛𝑛𝑓𝑠)
Although the electrical demand is higher in the summer, the winter season provides less average Insolation for PV energy production. Consequently, the system design constraints constitute a larger PV system for Winter electrical demand. The results of these calculations are shown in the table below. Table 2: Initial PV Specifications for Summer and Winter Electrical Demand (kWhe) Number of PV Modules Area of PV System (m2) Solar Insolation (avg.) (W/m2) Summer 58.2 14 21 800 Winter 47.65 15 22.5 600 So, the final PV system will be designed with the following specifications: Ppv = 2.65 kWe (Winter), N = 15 Panels, Apv = 22.5 m2 Ppv = 3.6 kWe (Summer) > 3.25 kWe (Summer Demand) It is important to note that the rating of each SunPower panel is 350 W [6], which would suggest an efficiency of about 23% under 1000 W/m2 Insolation conditions, however, these ratings are based on meteorological data different than that of Iraq, so an analysis was required using average Insolation in order to design the PV system for the spray-foamed housing in the Middle East.
SLIDE 28 The power output of the PV system along with the Insolation curves are shown below for each season of the year. The PV output values, in both seasons, area average values, and all the Insolation curves shown in Figure 17 are considered average and constant for simplicity of
- analysis. The low Insolation days will be covered by the backup Generator on days when Insolation
is low and PV energy production is insufficient to provide the electrical demand of the military housing.
Figure 17: PV System Output and Average Insolation Curves by Season
Analysis: It is important to note that Figure 9 represents the average power output of the PV system during a 12-hour production day for both the summer and winter months. Realistically, PV systems will not generate energy throughout 12 hours in every day. These assumptions were made for simplification of analysis and will be addressed later in this report. 4.2.6 Sizing the Energy Storage System for the PV System The ESS was designed for Summer, as the PV system produces more energy during this time of the year. The ESS will be designed to deliver the required electrical demand to the housing during the evenings, and store the same amount of electrical energy during the day from the PV system. The following equations were used in the sizing of the ESS: 𝑭𝑫𝒄𝒃𝒖 = 𝑸𝒒𝒘,𝒕𝒗𝒏𝒏𝒇𝒔 ∗ (𝒊𝒔𝒕 𝒑𝒈 𝒗𝒕𝒇) 𝐹𝐷𝑐𝑏𝑢 = (3.6 𝑙𝑋) ∗ (12ℎ𝑠𝑡) 𝑭𝑫𝒄𝒃𝒖 = 𝟓𝟒. 𝟑 𝒍𝑿𝒊 However, to account for round-trip efficiency and Depth of Discharge of the ESS, the capacity of the ESS system can be calculated by the following equation:
SLIDE 29
𝑭𝑫𝒃𝒅𝒖𝒗𝒃𝒎,𝑭𝑻𝑻 = 𝑭𝑫𝒄𝒃𝒖 ∗ 𝜽𝒄𝒃𝒖 𝑬𝑷𝑬 where, 𝑅𝑐𝑏𝑢 = 43.2 𝑙𝑋ℎ 𝜃𝑐𝑏𝑢 = 0.98 (Round Trip Efficiency) 𝐸𝑃𝐸 = 0.80 𝐹𝐷𝑏𝑑𝑢𝑣𝑏𝑚,𝐹𝑇𝑇 = (43.2 𝑙𝑋ℎ) ∗ (.98)/(.80) 𝑭𝑫𝒃𝒅𝒖𝒗𝒃𝒎,𝑭𝑻𝑻 = 𝟔𝟒 𝒍𝑿𝒊 This is the size of the ESS, such that the storage system can support the energy produced by the PV system at any point in time throughout the course of the year, operating under constant average Insolation assumptions. The ESS cyclic charge/discharge curve is shown below. It can be deduced that the ESS has a Depth of Discharge (DoD) of 80% of its capacity each day, and then is charged back to full capacity during the day by the PV system’s production over the assumed 12 hour day.
Figure 18: Cyclic Loading of the ESS for Summer
4.2.7 Selection of Thermal Management System (TMS) The selection of the Thermal Management System (TMS) for the ESS depends on a number of factors, including what type of fluid is used as the electrolyte in the ESS used, in order to maintain the ESS cell temperature and prevent overheating.
SLIDE 30 4.2.8 Financial Analysis of Hybrid PV/ESS System vs. Generator System In order to determine whether or not the PV system is economically feasible for this application, a financial analysis was conducted, comparing the cost of a Generator-powered HVAC system and the PV/ESS powered system over a project life of 12 years. It is important to note that time value
- f money is not considered in the analysis, and a simple payback period for the PV/ESS system is
- determined. The financial analysis is described and depicted step-by-step below.
Cost of Generator System Only:
𝐺𝑣𝑓𝑚 𝐷𝑝𝑡𝑢𝑓𝑜,𝑡 = (1.62 𝑙𝑋) ∗ 8760 ℎ𝑠𝑡 𝑧𝑠 ∗ (0.5 𝑧𝑠) ∗ (3413 𝐶𝑈𝑉 𝑙𝑋ℎ) ∗ ( 1 𝑚𝑐 18,000 𝐶𝑈𝑉) ∗ (1 𝑏𝑚𝑚𝑝𝑜 6 𝑚𝑐 ) ∗ ( $40 𝑏𝑚𝑚𝑝𝑜)
𝑮𝒗𝒇𝒎 𝑫𝒑𝒕𝒖𝒉𝒇𝒐,𝒕 = $𝟗𝟘𝟕𝟘. 𝟖𝟏 ≈ $𝟗𝟘𝟖𝟏/𝑻𝒗𝒏𝒏𝒇𝒔 Winter Fuel Cost Calculations:
𝐺𝑣𝑓𝑚 𝐷𝑝𝑡𝑢𝑓𝑜,𝑥 = (1.32 𝑙𝑋) ∗ 8760 ℎ𝑠𝑡 𝑧𝑠 ∗ (0.5 𝑧𝑠) ∗ (3413 𝐶𝑈𝑉 𝑙𝑋ℎ) ∗ ( 1 𝑚𝑐 18,000 𝐶𝑈𝑉) ∗ (1 𝑏𝑚𝑚𝑝𝑜 6 𝑚𝑐 ) ∗ ( $40 𝑏𝑚𝑚𝑝𝑜)
𝑮𝒗𝒇𝒎 𝑫𝒑𝒕𝒖𝒉𝒇𝒐,𝒙 = $𝟖𝟒𝟏𝟘/𝑿𝒋𝒐𝒖𝒇𝒔 Capital Cost of Generator: 𝐷𝑓𝑜 = ($600
𝑙𝑋𝑓) ∗(𝑄 𝑡)
𝑄
𝑡 > 𝑄 𝑥, thus, summer demand must be used in analysis
𝐷𝑓𝑜 = ($500 𝑙𝑋
𝑓
) ∗ (1.62 𝑙𝑋
𝑓)
𝑫𝒉𝒇𝒐 = $𝟘𝟖𝟑 Total Cost of Generator for Project Life: 𝑀𝐷𝐷𝑓𝑜,𝑢𝑝𝑢𝑏𝑚 = (𝐺𝑣𝑓𝑚 𝐷𝑝𝑡𝑢𝑓𝑜,𝑡 + 𝐺𝑣𝑓𝑚 𝐷𝑝𝑡𝑢𝑓𝑜,𝑥) ∗ (𝑄𝑠𝑝𝑘𝑓𝑑𝑢 𝑀𝑗𝑔𝑓) + 𝐷𝑓𝑜 𝑀𝐷𝐷𝑓𝑜,𝑢𝑝𝑢𝑏𝑚 = ([($8970) + ($7309)] ∗ (12 𝑧𝑓𝑏𝑠𝑡)) + ($972) 𝑴𝑫𝑫𝒉𝒇𝒐,𝒖𝒑𝒖𝒃𝒎 = $𝟐𝟘𝟕, 𝟒𝟑𝟏 Total Cost of PV+ESS System w/backup Generator for Project Life: 𝑀𝐷𝐷𝑓𝑜+𝑄𝑊 = (𝐺𝑣𝑓𝑚 𝐷𝑝𝑡𝑢)𝑓𝑜 + 𝐷𝑏𝑞𝑗𝑢𝑏𝑚 𝐷𝑝𝑡𝑢𝑓𝑜 + 𝐷𝑝𝑡𝑢𝐹𝑇𝑇 + 𝐷𝑝𝑡𝑢𝑄𝑊 Fuel Cost for Generator w/PV+ESS System (2 Days of Autonomy in each season):
S
SLIDE 31 𝐺𝑣𝑓𝑚 𝐷𝑝𝑡𝑢𝑓𝑜 𝑔𝑣𝑓𝑚,𝑞𝑤 = [(2)(58.2 𝑙𝑋ℎ) + (2)(47.65𝑙𝑋ℎ)] (3413 𝐶𝑈𝑉 𝑙𝑋ℎ) ( 1 𝑚𝑐 18,000 𝐶𝑈𝑉) (1 𝑏𝑚𝑚𝑝𝑜 6 𝑚𝑐 ) ( $40 𝑏𝑚𝑚𝑝𝑜)
𝑮𝒗𝒇𝒎 𝑫𝒑𝒕𝒖𝒉𝒇𝒐 𝒈𝒗𝒇𝒎,𝒒𝒘 = $𝟑𝟕𝟗/𝒛𝒔 𝐷𝑝𝑡𝑢𝑓𝑜,𝑞𝑤 = ($268 𝑧𝑠 ) ∗ (12 𝑧𝑓𝑏𝑠𝑡) + ($972) 𝑫𝒑𝒕𝒖𝒉𝒇𝒐,𝒒𝒘 = $𝟓𝟐𝟗𝟗 Cost of the Energy Storage System: 𝑫𝒑𝒕𝒖𝑭𝑻𝑻 = (
$𝟔𝟏𝟏 𝒍𝑿𝒊𝒇) ∗ (𝑹𝒎𝒑𝒃𝒆,𝒄𝒃𝒖) + 𝑫𝒑𝒕𝒖𝑼𝑵𝑻
𝐷𝑝𝑡𝑢𝐹𝑇𝑇 = (
$500 𝑙𝑋ℎ𝑓) ∗ (53 𝑙𝑋ℎ) + ($288)
𝑫𝒑𝒕𝒖𝑭𝑻𝑻 = $𝟑𝟕, 𝟖𝟓𝟗 Financial Calculations of PV System (sized for Winter): 𝐷𝑝𝑡𝑢𝑄𝑊 = ($2750 𝑙𝑋
𝑓
) ∗ (2.65 𝑙𝑋
𝑓)
𝑫𝒑𝒕𝒖𝑸𝑾 = $𝟖𝟑𝟗𝟗 Thus, the total cost of the Generator and PV system amounts to: 𝑀𝐷𝐷𝑓𝑜+𝑄𝑊 = ($7288) + ($26,748) + ($4188) 𝑴𝑫𝑫𝒉𝒇𝒐+𝑸𝑾 = $𝟒𝟗, 𝟑𝟑𝟓 Therefore, the PV+ESS system has less than 20% (≈ 19.5%) of the cost of the solo Generator set
- ver the project life of 12 years.
Simple Payback Period of PV System: 𝑸𝒃𝒛𝒄𝒃𝒅𝒍 𝑸𝒇𝒔𝒋𝒑𝒆: 𝑸𝑪 = 𝑱𝒐𝒋𝒖𝒋𝒃𝒎 𝑱𝒐𝒘𝒇𝒕𝒖𝒏𝒇𝒐𝒖 𝑫𝒑𝒕𝒖𝒕 𝑩𝒐𝒐𝒗𝒃𝒎 𝑺𝒇𝒖𝒗𝒔𝒐𝒕 Initial Investment Costs: Ipv = $7288 IESS = $9870 Total Initial Investment Cost: 𝑱𝒖𝒑𝒖𝒃𝒎 = 𝑱𝒒𝒘 + 𝑱𝑭𝑻𝑻
S
SLIDE 32
𝐽𝑢𝑝𝑢𝑏𝑚 = ($7288) + ($26,748) 𝑱𝒖𝒑𝒖𝒃𝒎 = $𝟒𝟓, 𝟏𝟒𝟕 Annual Returns: Fuel Savings per year with PV/ESS System: 𝑩𝒈𝒗𝒇𝒎 = 𝑫𝒑𝒕𝒖𝒈𝒗𝒇𝒎,𝒉𝒇𝒐 − 𝑫𝒑𝒕𝒖𝒈𝒗𝒇𝒎,𝒒𝒘 where: 𝐷𝑝𝑡𝑢𝑔𝑣𝑓𝑚,𝑓𝑜 = ($8970/Summer) + ($7309/Winter) = $16,279/yr 𝐷𝑝𝑡𝑢𝑔𝑣𝑓𝑚,𝑞𝑤= $268/yr Savings on Generator fuel per year: 𝐵𝑔𝑣𝑓𝑚 = (
$16,279 𝑧𝑠
) − (
$268 𝑧𝑠 )
𝑩𝒈𝒗𝒇𝒎 = $𝟐𝟕, 𝟏𝟐𝟐/𝒛𝒔 𝑸𝑪 = 𝑱𝒖𝒑𝒖𝒃𝒎 𝑩𝒈𝒗𝒇𝒎 = $34,036 $16,011 𝑄𝑏𝑧𝑐𝑏𝑑𝑙 𝑄𝑓𝑠𝑗𝑝𝑒: 𝑸𝑪 = 𝟑. 𝟐𝟒 𝒛𝒔𝒕 ≈ 𝟒 𝒛𝒔𝒕 Note: This payback period does not take into account possible maintenance requirements associated with the PV system, ESS, or the Generator. The payback period is rounded up in this case, as is typical for payback period calculations, in order to determine an integer number of years required to make back, the initial investment costs. The capital cost for the Generator is not included, as it is part of the existing system. Additionally, this financial analysis does not take into account all of the installation costs that may be associated with the ESS. However, the initial financial calculations validate the notion that this project has promise, and should be researched further. 4.3 Optimization Algorithm for Design The generalized algorithm for optimizing the PV/ESS/Generator system is shown in Figure 19. This process is different than the one used in the simplified case analysis, in that it accounts for days of high and low Insolation, full ESS charge, and lack of PV energy production. In this model, the PV field size is an input, as is the size of the ESS. The process begins with inputting weather data and solar Insolation data for the specific area of interest. This algorithm can be implemented in order to optimize the design of the system that consists of a PV, ESS, and Generator system. However, it is important to note that a wide range of each variable should be run through the algorithm in “Monte Carlo” fashion, in order to identify the optimized system case. The optimum system will have the lowest life cycle cost.
S
SLIDE 33 Figure 19: Optimization Algorithm for Designing PV/ESS System
4.4 Phase 6: Final Work The final work completed during Phase 6 of the Applied Project consisted of writing the Final Report, double-checking references, and preparing the final presentation for the Applied Project
- Defense. Phase 6 also included the submission of multiple drafts of the Final Report and Defense
Presentation to the Faculty and Industry advisors. Additionally, meeting minutes with advisors were documented and recorded in the Applied Project Notebook, as well as the final labors logged into the Notebook as well. A reflection of the overall Applied Project, and the management of the project were also performed with the advisors during this phase, along with discussion of recommendations and lessons learned throughout the course of the Applied Project.
SLIDE 34
The Applied Project met the adjusted problem statement requirements relatively well. This is due, in part, to the fact that my advisors and I altered the scope of the project in order to ensure that the project would be completed on time, while also providing enough analysis and research to justify an Applied Project. Based on the project results the following was concluded:
- 1. The Applied Project met the reduced scope problem statement requirements. This was due to
good project management and the advisors willing to accept a reduced scope of work that still met the program goals.
- 2. A simplified case study showed that the use of PV/ESS/Generator system shows potential life
cycle cost savings as compared to the conventional use of just a fueled Generator to provide the electrical demands of a 10-person military tent barracks in Baghdad, Iraq. This analysis was based
- n optimistic and simplified assumptions. It does show that under these assumptions the proposed
system has considerable potential and is worthy of further research.
- 3. A generalized algorithm for optimizing the PV/ESS/TMS and Generator system on a life cycle
cost basis was developed. It is recommended that this algorithm be used to accomplish more detailed research into this subject.
SLIDE 35
One of the main recommendations for this project, is that future researchers should it be take into account Time Value of Money in their analysis, as well as the inconsistency of Insolation. The analysis in this Applied Project assumes an average, constant Insolation for both the winter and summer months, in an attempt to make the calculations more simple than realistic PV system calculations would be for this project. A complete analysis of Insolation and temperature variance is required for further research and more precise results. Additionally, the analysis performed in this project assumed via literature, that the HVAC demand was 75% of the total electrical demand, and that the HVAC system consisted of a Coefficient of Performance value of 2. More investigation is needed to determine if these assumptions are accurate. All of the assumed efficiency values that are provided in this report require further investigation, including consideration of the fact that efficiency of PV modules is a function of temperature, and the hours
- f production for the PV system vary throughout the year. Additionally, Generator efficiency
should be explored as well. Ideally, the optimization algorithm would be run using thousands of different combinations of inputs in order to find which combination produces the optimum system for the lowest LCC. The optimization algorithm that was developed as a means of providing a guideline with which to follow, when designing a stand-alone PV system with energy storage for an HVAC system in a remote area. This algorithm can be followed and then optimized by performing a more complex analysis that involves less simplistic assumptions. In addition to the prior recommendations, it is recommended that the next researcher analyze how the amount of Insolation received affects the financial cost of the solar panels. An analysis of this correlation may provide more accurate results. The financial analysis in this report assumed a fixed cost for each kWe, when this assumption may not be realistic. Another cost to consider would be
- peration and maintenance costs related to the PV and ESS system. These calculations are not
considered in this analysis, but would realistically have an impact on the payback period and
- verall cost of the hybrid system. There are also additional materials that would need to be
including this system, including a Thermal Management System for the ESS, and an analysis of the cost of these extra materials would produce a more thorough financial analysis. Degradation
- f the ESS should also be considered, and thus, the ESS should be oversized in order to account
for this.
SLIDE 36
Overall, the Applied Project was a success, in that it accomplished the goals and objectives that were set forth by the student and the advisers. There was a notable amount of project schedule adjustment and scope adaptation, but the result met the final scope, objectives, and requirements
- f the problem statement. The advisors played a predominant role in assisting the student in project
management throughout the duration of the project. Additionally, the Project Notebook was kept up-to-date throughout the entirety of the Applied
- Project. Advisor meeting minutes, worksheets, the Shark Tank Presentation, work from different
phases of the project previously discussed, along with the time log were all kept in an orderly fashion in the Notebook. Unexpected issues arose during the project, which have previously been addressed in the report. To summarize, some of the main difficulties facing the student from the onset of the project was the number of labor-loading hours available for the Applied Project, and fitting a desired project inside the scope of that timeframe. Additionally, the data required in order to run a thorough and complete optimization analysis was more difficult to acquire than previously anticipated. This led to a stall in the progress of the Applied Project. The advisors aided the student in limiting the scope
- f the project to focus on a more systems approach to the problem in order to combat this issue.
This approach led to the derivation of an optimization algorithm fir the design of a PV/ESS/Generator hybrid system for spray-foam insulated military housing. The project scope adjustment was a solution to both of the aforementioned issues and helped to keep the Project Schedule as punctual as possible. The risk mitigation plan presented in the Project Proposal did not play as much of a role as initially expected or intended, as unexpected issues arose outside of the risk mitigation plan. All variances in the schedule were addressed in the review sessions with the advisors, and recommendations were made in order to improve the Applied Project
- management. This will be covered in the Defense Presentation as well.
SLIDE 37
Throughout the course of the project, there were several lessons learned. One of the first lessons learned during the Applied Project, was that the Project Plan is a fluid document, and is constantly changing and evolving for various reasons. There are always unforeseen circumstances and
- bstacles to success that arise during a project, and the Applied Project was no exception. The
scope and objectives of my Applied Project were altered due to time constraints. The original process was to optimize a PV system to solely power an HVAC system and other electrical loads
- f military housing in the Middle East.
The final result of the project was an algorithm that shows this process while making basic assumptions about Insolation, weather data for average days in the summer and winter, efficiencies for assets, and no Time Value of Money considerations in order to simplify the analysis. The lesson learned here, was that the scope and objectives of a project can always pivot, and be altered as
- necessary. Additionally, I learned that it is better to provide oneself with a conservative estimate
- f time allowance for contingencies, as they inevitably arise more frequently than I had originally
- believed. Additionally, I learned that the Applied Project is an iterative process, and can take
multiple iterations to come to the result that is desired. The iterations were improved upon by receiving guidance from my advisors. Some of these lessons learned can lead to iterative methods to solving some problems in the solar industry, and hopefully, fewer iterations upon making necessary real-time adjustments to project plans and the approach that I use to solve problems. Additionally, I learned how to design a PV system for an off-grid HVAC system in the Middle East, utilizing the skills that I acquired during my undergraduate degree in mechanical engineering, as well as the solar energy engineering concepts during the culmination of this project. The algorithm displayed in the analysis section involves: heat load analysis (thermal heat transfer), electrical energy conversion principles (from thermal energy), PV system design modeling, ESS capacity calculations, and economic analysis. These skills were sharpened with each refinement
- f the algorithm during the project. All of these concepts are relevant to the solar industry, and
will serve me well as I enter my professional engineering career.
SLIDE 38
(1) “Environment, Energy Security, & Sustainability (E2S2) Symposium & Exhibition.” National Defense Industrial Association, e2s2.ndia.org/. (military housing) (2) “Solar Resource Maps of Iraq.” Solargis, solargis.com/maps-and-gis-data/download/iraq/. (3) “Energy Efficiency.” Hydroelectric Power Generation, www.mpoweruk.com/energy_efficiency.htm. (4) “How to Calculate the Annual Solar Energy Output of a Photovoltaic System?” How to Calculate the Output Energy or Power of a Solar Photovoltaic System, Excel PV Calculator to Estimate Solar Electricity Output., photovoltaic-software.com/PV-solar-energy-calculation.php. (5) “2018 Most Efficient Solar Panels on the Market | EnergySage.” Solar News, EnergySage, 19 July 2018, news.energysage.com/what-are-the-most-efficient-solar-panels-on-the-market/. (Solar efficiency) (6) SunPower. “Home Solar Panels, Commercial & Utility-Scale Solar Solutions | SunPower.” SunPower - United States, SunPower, 23 Feb. 2018, us.sunpower.com/. (Solar Module Specifications) (7) “Estimation of Global Solar Radiation on Horizontal Surface Using Routine Meteorological Measurements for Different Cities in Iraq.” An Economic Study of the Demand for Red Meat in the Kingdom
Saudi Arabia Using Almost Ideal Demand System
Responsive Version, scialert.net/fulltext/?doi=ajsr.2010.240.248. (Iraq solar irradiation) (8) Matasci, Sara. “2018 Solar Panel Cost | Updated Avg. Solar System Prices by Location.” Solar News, EnergySage, 16 July 2018, news.energysage.com/how-much-does-the-average-solar-panel-installation- cost-in-the-u-s/. (PV cost per kW) (9) “ESSteries Keep On Getting Cheaper.” CleanTechnica, 11 Dec. 2017, cleantechnica.com/2017/12/11/ESSteries-keep-getting-cheaper. (Cost of ESS per kWh) (10) “Price vs The True Cost of Lithium-Ion ESSteries Simplified.” SimpliPhi Power, 6 Mar. 2017, simpliphipower.com/price-vs-true-cost-lithium-ion-ESSteries-simplified/. (Round trip efficiency of
ESSteries)
(11) “How Much Does Solar Storage Cost? Understanding Solar ESS Prices.” EnergySage, www.energysage.com/solar/solar-energy-storage/what-do-solar-ESSteries-cost/. (Cost of ESS per
kWh)
(12) “Online Solar Training: Advanced PV Systems with Energy Storage.” Solairgen Home, solairgen.com/4- advanced-class/. (ESS Picture/PV configuration) (13) Petersen, John. “Demystifying Energy Storage System Costs.” Seeking Alpha, Seeking Alpha, 9 July 2012, seekingalpha.com/article/708131-demystifying-energy-storage-system-costs?page=2. (TMS) (14) G.H. Kim, and A Pesaran. “Attery Thermal Management Syst.”, NREL, www.nrel.gov/transportation/assets/pdfs/40446.pdf. (TMS system Analysis) (15) CiteSeerX, citeseerx.ist.psu.edu/.
SLIDE 39 (16) "Planned DoD Wide Renewable Energy Capacity Additions 2012-2017", SEIA, www.seia.org/sites/default/files/DOD wide renewable energy capacity additions-LOGO_0.png. (17) “SEC Applied Project Handbook”, Steven Trimble, August 2017
(18) “Baghdad Monthly Climate Averages.” WorldWeatherOnline.com, World Weather Online Blog,
www.worldweatheronline.com/baghdad-weather-averages/baghdad/iq.aspx. (19) “How Much Does a Commercial Generator Typically Cost? - Blog.” American Generators Sales & Service, LLC., www.americanGeneratorsmi.com/about/blog/How-Much-Does-a-Commercial-Generator- Typically-Cost_AE12.html. (19) Tony Hankins. “US Army ComESSs Desert Heat and Fuel Costs with SPF.” The Cheapest and Cleanest Energy Is Energy Saved, PUreview, Aug. 2010, www.huntsman.com/polyurethanes/Media Library/a_MC1CD1F5AB7BB1738E040EBCD2B6B01F1/Products_MC1CD1F5AB8081738E040EBCD2B6B0 1F1/files/pu_review_04.pdf.
(20) “Micro-Inverters: Advantages and Disadvantages in Solar Photovoltaic Systems.” Sovereign Solar, 25
- Apr. 2015, sovereignsolar.wordpress.com/2012/07/13/micro-inverters-advantages-and-disadvantages-
in-solar-photovoltaic-systems-2/.
SLIDE 40
Table A1: Temperature Data for Iraq Used for Heat Transfer Calculations Time
- Avg. Winter Day Temp (oF)
- Avg. Summer Day Temp (oF)
12:00 AM 45 45 80 80 1:00 AM 45 45 81 81 2:00 AM 46 46 82 82 3:00 AM 47 47 82 82 4:00 AM 49 49 83 83 5:00 AM 52 52 84 84 6:00 AM 55 55 87 87 7:00 AM 60 60 94 94 8:00 AM 63 63 100 9:00 AM 64 64 106 10:00 AM 65 65 109 11:00 AM 65 65 110 12:00 P PM 65 65 110 1:00 PM 65 65 110 2:00 PM 64 64 110 3:00 PM 63 63 109 4:00 PM 60 60 108 5:00 PM 55 55 105 6:00 PM 52 52 92 92 7:00 PM 49 49 87 87 8:00 PM 47 47 85 85 9:00 PM 46 46 82 82 10:00 P PM 45 45 81 81 11:00 P PM 45 45 80 80 Table A2: Army Corps of Engineers Reference for Cooling Loads for Military Housing
SLIDE 41
Figure 1A: Spray-Foamed Insulated Military Housing in the Middle East Figure 2A: Reference for 75% of Electrical Demand Being HVAC
Software Usage for Analysis: MATLAB Code:
% SEC Applied Project clear all close all
SLIDE 42
% Load Profiles hrs = [1:24]; time = [-12:1:12]; h = 25; k = 0.20; t = 0.0381*(1.75); U = 1/((1/h)+(t/k)); To_s = zeros(1,length(hrs)); A = (16*0.3048)*(32*0.3048); To_s(1:12) = [80 81 82 82 83 84 87 94 100 106 109 110] ; To_s(13:24) = [110 110 110 109 108 105 92 87 85 82 81 80]; Ti = 75; for n = 1:length(hrs) dts(n) = To_s(n) - Ti; Qs(n) = U.*A.*dts(n); if Qs(n) <0 Qs(n) = 0; end Qs(n) = Qs(n)./1000; end Qmax_s = max(Qs); Qs_avg = mean(Qs); Es = sum(Qs); To_w = zeros(1,length(hrs)); A = (16*0.3048)*(32*0.3048); To_w(1:12) = [45 45 46 47 49 52 55 60 63 64 65 65]; To_w(13:24) = fliplr(To_w(1:12)); Ti = 70; for n = 1:length(hrs) dtw(n) = To_w(n) - Ti; Qw(n) = abs(U.*A.*dtw(n)); % if Qs(n) <0 % Qs(n) = 0; % end Qw(n) = Qw(n)./1000; Qw(n) = abs(Qw(n)); end Qmax_w = max(Qw); Qw_avg = mean(Qw); loadw_avg = Qw_avg/0.75; Ew = sum(Qw); Power_s = Qmax_s/(0.75);
SLIDE 43
Power_w = Qmax_w/(0.75); Qpv = sum(Qw(6:18))/12; figure plot(hrs,Qs,'b') hold on plot(hrs,Qw,'k') title('Heat Load Profiles'); xlabel('Hour of the Day'); ylabel('Thermal Heat Load (kWt)'); legend('Summer Load', 'Winter Load') % Irradiance Profiles Gs = zeros(1,length(hrs)); Gw = zeros(1,length(hrs)); Gs(1:5) = 0; Gs(6) = 30; Gs(7) = 100; Gs(8) = 500; Gs(9) = 700; Gs(10) = 790; Gs(11) = 800; Gs(12) = 800; Gs(13:18) = fliplr(Gs(6:11)); Gw(6:12) = [10 30 100 300 575 600 600]; Gw(13:18) = fliplr(Gw(6:11)); Gmax_s = max(Gs); Gmax_w = max(Gw); figure plot(hrs,Gs,'b'); hold on plot(hrs,Gw,'k'); title('Average Irradiance for Summer and Winter'); xlabel('Hour of Day'); ylabel('Irradiance (w/m^2)'); legend('Summer Irradiance','Winter Irradiance'); ylim([0, 900]); % Calculation of panels for PV system: Apv = 1.5; eff = 0.20; Ns = (Power_s*1000)/(eff*Apv*Gmax_s); Nw = (Power_w*1000)/(eff*Apv*Gmax_w); % Calculations for ESS eff_inv = 0.96; eff_wire = 0.98; % QESS = load_s = (1.62)*(6); QESS = [53-load_s 53-(2*load_s) 53-load_s 53 53-load_s]; AM_6 = 6; PM6 = 6;
SLIDE 44
Time = [0 6 12 18 24]; figure plot(Time, QESS,'b') xlim([0, 24]) title('Cyclic Charging and Discharging of ESS vs Time of Day'); xlabel('Hour of Day'); ylabel('ESS Capacity (kWh)');