
SLIDE 1
SCHOOL BUDGET
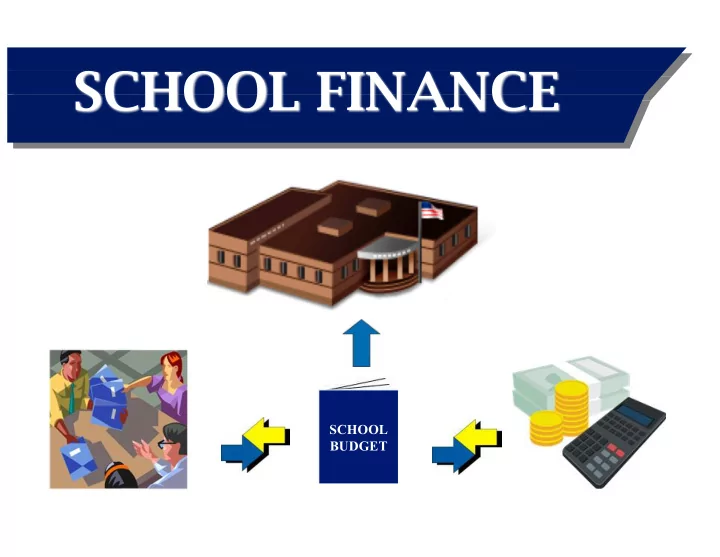
SCHOOL FINANCE SCHOOL BUDGET I. School District Total Revenue - - PowerPoint PPT Presentation
SCHOOL FINANCE SCHOOL BUDGET I. School District Total Revenue Sources ( State Report Card) State Your Average District State 49.2% ?? % Local 39.4% ?? % Federal 11.4% ?? % 2 State Funding Where does it come from? Sales Tax
SCHOOL BUDGET
(State Report Card)
2
3
Formula that determines the funding level required for each school system to provide a common, basic level of service for all students.
4
ØAdopted by the Legislature in 1992 as part
ØDeveloped in response to Small Schools I lawsuit, where TN Supreme Court ruled State’s previous school funding formula was inequitable Ø“Funding formula, not a spending plan”
5
funding (fiscal capacity; cost differential factor)
6
Formula contains a number of components (46 total) that the Legislature has deemed necessary for schools to succeed.
7
Ø ADMs (student enrollment) drive the formula – funded on prior year’s ADMs
year growth. This is outside the BEP, but distributed based on the BEP formula
Ø ADMs generate:
equipment, textbooks, travel, capital outlay, etc.
Ø Funding months and weighting
Month 6 – 35%
Month 7 – 35%
8
Formula contains instructional salaries, instructional benefits, classroom and non-classroom components: ØInstructional Components (State = 70% / Local = 30%)
ØClassroom Components (State = 75% / Local = 25%)
ØNon-Classroom Components (State = 50% / Local = 50%)
9
Formula determines actual state share of education funding by each county’s relative ability to fund education from its own local sources:
10
ØCounty’s “ability to pay”
Intergovernmental Relations (TACIR)
Research (CBER)
ØExpressed as an index measure, which is a proportion of the total fiscal capacity for all counties
11
Ø Per pupil own-source revenue Ø Per pupil equalized property assessment Ø Per pupil taxable sales Ø Per capita income Ø Tax Burden Ø Service Burden
12
Ø Determines a county’s capacity to raise local revenues for education from its property and sales tax base Ø Each county’s fiscal capacity is the sum of:
multiplied by a statewide average property tax rate for education
sales tax rate for education
13
Ø Used to adjust BEP funding in systems where the cost of living in the county is greater than the statewide average Ø Compares county wages in non-government industries to statewide wages Ø Counties with above-average wages according to this index receive an increase Ø Increase is applied to salaries, retirement contributions and FICA contributions Ø Eliminated in BEP 2.0 Ø Counties receiving an adjustment currently receive 25% of the calculated CDF
14
12
13
Unit Costs
CDF Fiscal Capacity Salaries, Retirement, Insurance
16
Instructional Classroom Non-Classroom
Regular Education Career & Technical Education Special Education Elementary Guidance Secondary Guidance Elementary Art Elementary Music Elementary Physical Education Elementary Librarians (K-8) Secondary Librarians (9-12) ELL Instructors ELL Translators Principals Assistant Principals Elementary Assistant Principals Secondary System-wide Instructional Supervisors Special Education Supervisors Career and Technical Education Supervisors Special Education Assessment Social Workers Psychologists RTII Staff Benefits, Insurance, Retirement K-12 At-risk Duty-free Lunch Textbooks Classroom Materials and Supplies Instructional Equipment Classroom Related Travel CTE Center Transportation Technology Nurses Instructional Assistants Special Education Assistants Staff Benefits, Insurance, Retirement Substitute Teachers Alternative schools Superintendent System Secretarial Support Technology Coordinators School Secretaries Maintenance and Operations Non-instructional Equipment Pupil Transportation Staff Benefits, Insurance, Retirement Capital Outlay
17
Ø Tennessee Basic Education Program: An Analysis
§ https://www.comptroller.tn.gov/office-functions/research-and- education-accountability/legislative-toolkit/bep.html See the Legislative Brief
Ø State Board of Education
§ https://www.tn.gov/sbe/committees-and-initiatives/the-basic- education-program.html
§ BEP Blue Book – up to date data on BEP components § Recommendations of the BEP Review Committee § BEP Handbook for Computation– comprehensive guide
21