
SLIDE 1
SANJEEV MEHTA
1.
Identify factors responsible for the slowdown
- f
food grain production in Bhutan since 1990.
- 2. Explore possible means to accelerate the
growth rate of food grain production growth rate of food grain production
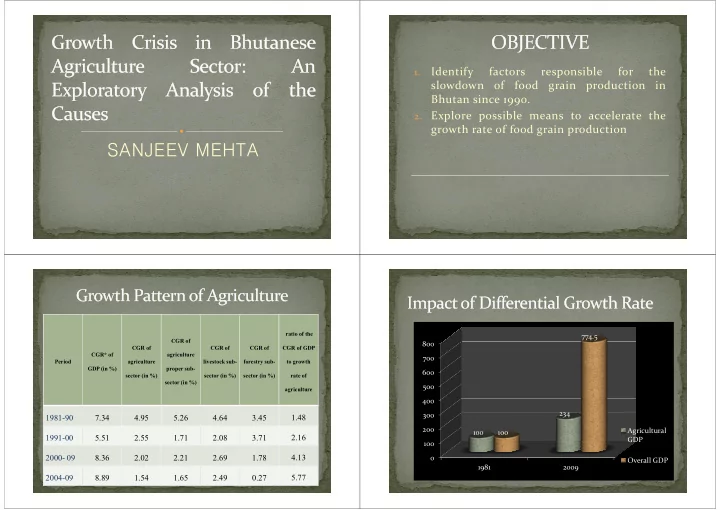
- 600
700 800 774.5 100 200 300 400 500 1981 2009 100 234 100 Agricultural GDP Overall GDP