
SLIDE 1
rusticus on local freshwater ecology Anthony Bonifonte Mentor Angie - - PowerPoint PPT Presentation
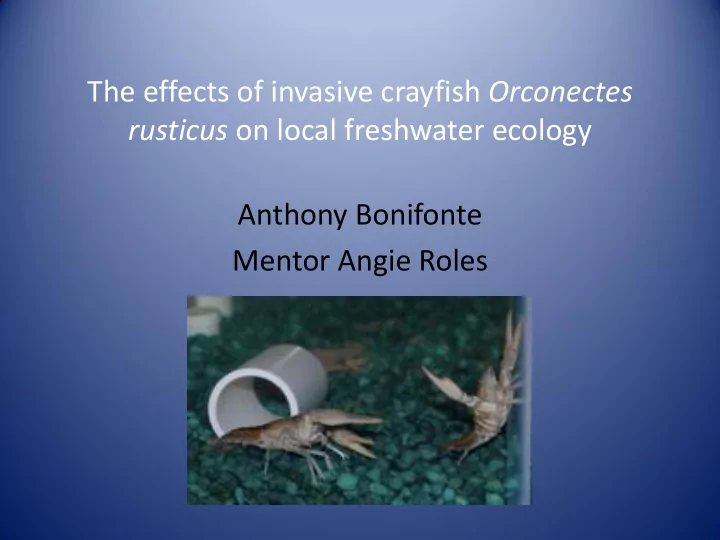
The effects of invasive crayfish Orconectes rusticus on local freshwater ecology Anthony Bonifonte Mentor Angie Roles Rusty native range Rusty invasive range Species # of Species Standard Number of present deviation sites rusty 42
Rusty native range Rusty invasive range
10 20 30 40 50 60 rusty sanborn
# species present
rusty sanborn
10 20 30 40 50 60 rusty sanborn
# species present
rusty sanborn
Present only at sanborn sites Present only at rusty sites Species % of san. sites present at Erpobdella punctata (leech) 38.9 Optioservus (riffle beetles) 38.9 Parametriocnemus (midges) 33.3 Chrysops (deer/horse flies) 50 Species % of rusty sites present at Neoperla clymene (stoneflies) 45.5 Petrophila (moths) 45.5 Telopelopia okoboji (midges) 45.5
Snails 10 species total Mollusks 23 species total Species # of species present
N rusty 1.36 1.206 11 sanborn 2.11 1.08 18
p=.0938
Species # of species present
N rusty 2.45 1.206 11 sanborn 4.06 1.08 18
p=.1101
Site 2007 2008 2009 2010 Downstream LLB 12 25 5 7 HRM 30 49 19 31 HWB n/a 73 47 48 HTR 73 80 72 86 Upstream HML n/a 100 100 100 Percent Sanborn Composition
0.05 0.1 0.15 0.2 0.25 0.3 2007 2008 2009 2010
0.1 0.2 0.3 0.4 0.5 0.6 2007 2008 2009 2010
0.1 0.2 0.3 0.4 0.5 0.6 0.7 0.8 0.9 2007 2008 2009 2010