
SLIDE 1
1
Robert E. Ratner, MD Chief Scientific and Medical Chief Scientific and Medical Officer
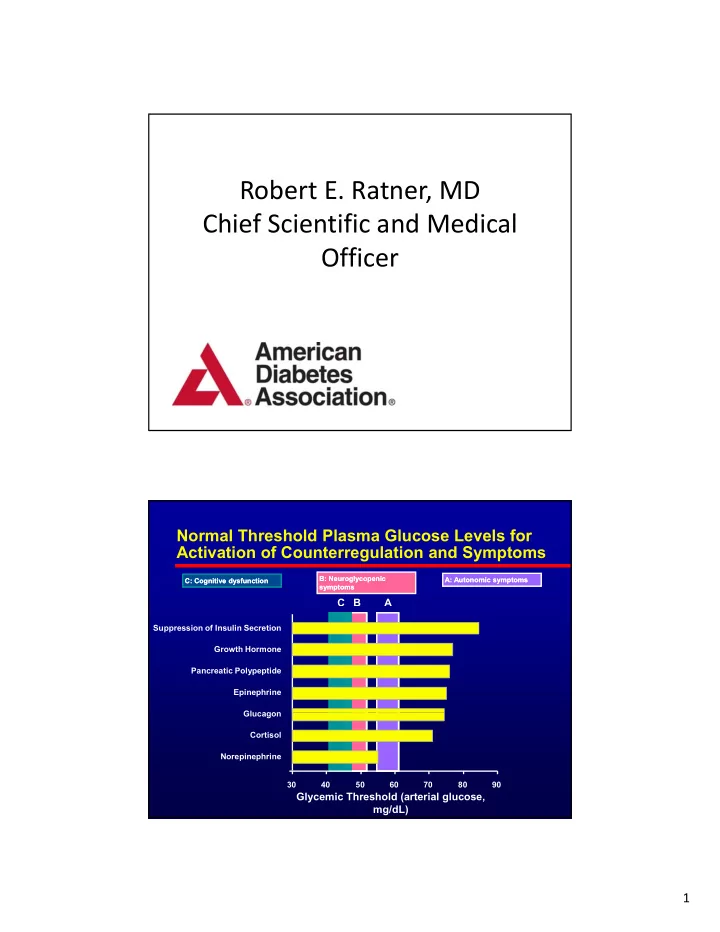
B C A
A: Autonomic symptoms A: Autonomic symptoms B: Neuroglycopenic B: Neuroglycopenic symptoms symptoms C: Cognitive dysfunction C: Cognitive dysfunction
Normal Threshold Plasma Glucose Levels for Activation of Counterregulation and Symptoms
Glucagon Epinephrine Pancreatic Polypeptide Growth Hormone Suppression of Insulin Secretion 30 40 50 60 70 80 90 Norepinephrine Cortisol Glucagon
Glycemic Threshold (arterial glucose, mg/dL)