Risk model for short-term risk for interval cancers and screening - - PowerPoint PPT Presentation

risk model for short term risk
SMART_READER_LITE
LIVE PREVIEW

Risk model for short-term risk for interval cancers and screening - - PowerPoint PPT Presentation

6/9/2017 Disclosures No disclosures to declare Microcalcifications, density, masses, hormonal factors, family history of BC in a 2-year risk model for potential use in screening Mikael Eriksson, MEB, Karolinska Institutet, Sweden Overview


slide-1
SLIDE 1

6/9/2017 1

Microcalcifications, density, masses, hormonal factors, family history of BC in a 2-year risk model for potential use in screening

Mikael Eriksson, MEB, Karolinska Institutet, Sweden

Disclosures

No disclosures to declare

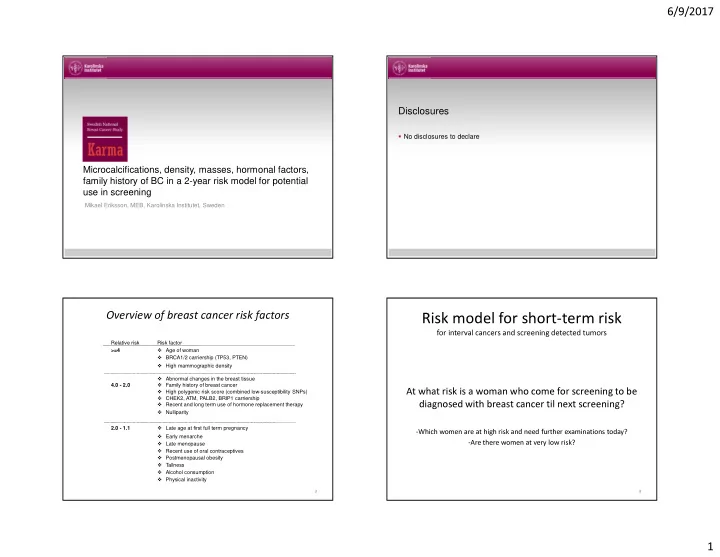
Relative risk Risk factor >=4 Age of woman BRCA1/2 carriership (TP53, PTEN) High mammographic density 4.0 - 2.0 Abnormal changes in the breast tissue Family history of breast cancer High polygenic risk score (combined low-susceptibility SNPs) CHEK2, ATM, PALB2, BRIP1 carriership Recent and long term use of hormone replacement therapy Nulliparity 2.0 - 1.1 Late age at first full term pregnancy Early menarche Late menopause Recent use of oral contraceptives Postmenopausal obesity Tallness Alcohol consumption Physical inactivity

Overview of breast cancer risk factors

3

Risk model for short-term risk

for interval cancers and screening detected tumors

At what risk is a woman who come for screening to be diagnosed with breast cancer til next screening?

  • Which women are at high risk and need further examinations today?
  • Are there women at very low risk?

4

slide-2
SLIDE 2

6/9/2017 2

Study design

KARMA incident breast cancer cases and controls (Swedish screening cohort) Mammographic density (measured using STRATUS software) Microcalcifications and masses (measured using iCAD, automatted reading) Age, BMI, family history of BC, menopause status, use of HRT1 Prospective nested case – control study design. 2-year follow-up.

5

  • 1. Hormone replacement therapy

Characteristics of the women in the study

Study participant characteristics Incident cases Controls p-value

1

Number of women 433 1732 . Age at breast cancer diagnosis, mean (SD1) 59.0 (9.4) . . Years from mammography to breast cancer, median 1.74 . . Invasive breast cancer, % 88 . . Screening detected breast cancer, % 63 . . Age at mammography, mean (SD1) 57.4 (9.2) 57.4 (9.2) 0.99 BMI, mean (SD1) 25.6 (4.6) 25.3 (4.0) 0.19 Age at menarche, mean (SD1) 13.1 (1.4) 13.2 (1.5) 0.61 Parity, % 89 88 0.56 Age at first birth, mean (SD1) 27.1 (5.4) 26.6 (5.2) 0.11 Current use of HRT, % 6.9 4.4 0.05 Postmenopausal, % 65 65 0.78 Breast cancer in family, % 19 13 4.5x10⁻⁴

1SD = standard deviation. 2p-values for means were calculated with Student's T-test, medians with Wilcoxon rank-sum test and percentages with chi-square test.

6

Relative risks of breast cancer within 3 years of a negative mammography screen

Study participant and mammographic features HR (95% CI) Current use of HRT (same year user vs. previous or non-user) 1.3 (0.9-2.0) Family history of breast cancer 1.3 (1.0-1.7) Percent mammographic density (cBIRADS 4 vs. 1) 4.8 (2.6-8.8) Percent mammographic density (per standard-deviation) 1.6 (1.4-1.8) Number of microcalcifications (category 4 vs. 0) 2.0 (1.3-3.2) Number of masses (4 vs. 0) 1.7 (0.8-3.5) Individual absolute difference between breasts Percent mammographic density 1.9 (1.2-3.0) Number of microcalcifications 2.8 (1.8-4.5) Number of masses 1.1 (0.6-1.9)

Relative risks are higher in women with higher levels of mammographic density, number microcalcifications and number masses

Mammographic features combined HR1 (95% CI)

  • 1. (cBIRADS 1, microcalcification category 0, 0 masses), reference

1.0

  • 2. (cBIRADS 2, microcalcification category 1, 1 masses)

4.3 (2.4-7.5)

  • 3. (cBIRADS 3, microcalcification category 2, 2 masses)

7.9 (4.2-15.2)

  • 4. (cBIRADS 4, microcalcification category >= 3, >=3 masses)

8.7 (4.7-16.0)

1HR = hazard ratio.

slide-3
SLIDE 3

6/9/2017 3

Discrimination performance in comparison to established risk models

Model AUC 95% CI

  • 1. Percent mammographic density, age at mammography, BMI

0.63 0.60-0.65

  • 2. Model 1 + family history of breast cancer, HRT use

0.64 0.62-0.67

  • 3. Model 2 + absolute differences for calcifications, masses, density

0.70 0.68-0.72

  • 4. Model 3 + interaction between percent density and masses

0.71 0.69-0.73 Established risk models for comparison Tyrer-Cuzick 0.63 0.60-0.65 Gail 0.56 0.53-0.58

Absolute 2-year risk1 (risk group) Percent women at risk Mean absolute 2-year risk2 Stratified 2-year risk 0-0.15 (low) 10.3 0.12 1.0 (reference) 0.15-<0.6 (general) 64.8 0.33 2.75 0.6-<1.6 (moderate) 22.9 0.82 6.83 ≥1.6 (high) 2.0 1.95 16.2

Distribution of 2-year absolute risks in the KARMA cohort

N=60,807 women

Number of breast cancer cases diagnosed during study follow- up stratified by baseline predicted risks in the KARMA cohort

Quintile of predicted 2-year absolute risk at baseline Actually diagnosed cases Q1 Q2 Q3 Q4 Q5 Q5 / Q1 Q5 % Breast cancer cases (N=570) Current model 31 62 68 125 284 9.2 50 Tyrer-Cuzick 45 84 113 127 201 4.5 35 Gail 103 88 102 107 170 1.7 30 Invasive cases (N=471) Current model 27 58 61 108 217 8.0 46 Tyrer-Cuzick 40 67 97 107 160 4.0 34 Gail 90 71 83 89 138 1.5 29 Interval cases (N=175) Current model 7 13 15 61 98 14 55 Tyrer-Cuzick 12 19 35 43 66 5.5 37 Gail 38 19 37 30 51 1.3 29

Conclusion

Three mammographic features together with a few lifestyle factors identifies women in need of additional examination procedures There is a substantial group of low risk women that may have little benefit from mammography screening

slide-4
SLIDE 4

6/9/2017 4

Thank you!

Per Hall, Karolinska Institutet Kamila Czene, Karolinska Institutet Yudi Pawitan, Karolinska Institutet Hatef Darabi