
SLIDE 1
Department of Social and Decision Sciences
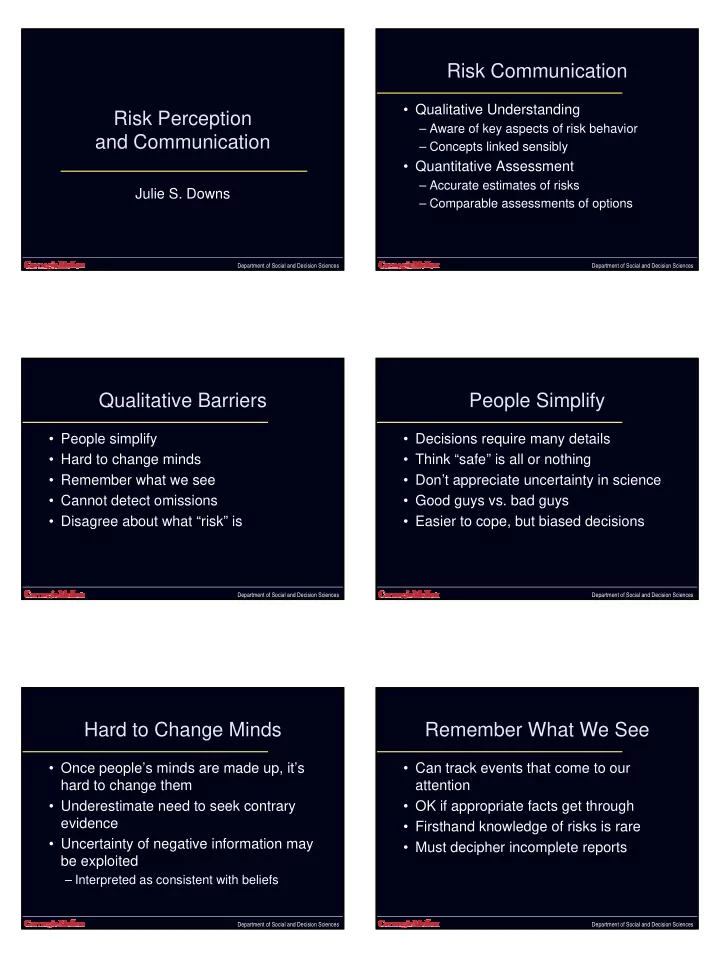
Risk Perception and Communication
Julie S. Downs
Department of Social and Decision Sciences
Risk Communication
- Qualitative Understanding
– Aware of key aspects of risk behavior – Concepts linked sensibly
- Quantitative Assessment
– Accurate estimates of risks – Comparable assessments of options
Department of Social and Decision Sciences
Qualitative Barriers
- People simplify
- Hard to change minds
- Remember what we see
- Cannot detect omissions
- Disagree about what “risk” is
Department of Social and Decision Sciences
People Simplify
- Decisions require many details
- Think “safe” is all or nothing
- Don’t appreciate uncertainty in science
- Good guys vs. bad guys
- Easier to cope, but biased decisions
Department of Social and Decision Sciences
Hard to Change Minds
- Once people’s minds are made up, it’s
hard to change them
- Underestimate need to seek contrary
evidence
- Uncertainty of negative information may
be exploited
– Interpreted as consistent with beliefs
Department of Social and Decision Sciences
Remember What We See
- Can track events that come to our
attention
- OK if appropriate facts get through
- Firsthand knowledge of risks is rare
- Must decipher incomplete reports