
SLIDE 1
Recommendation: Dynamic Capacity Refund Regime
22 November 2012
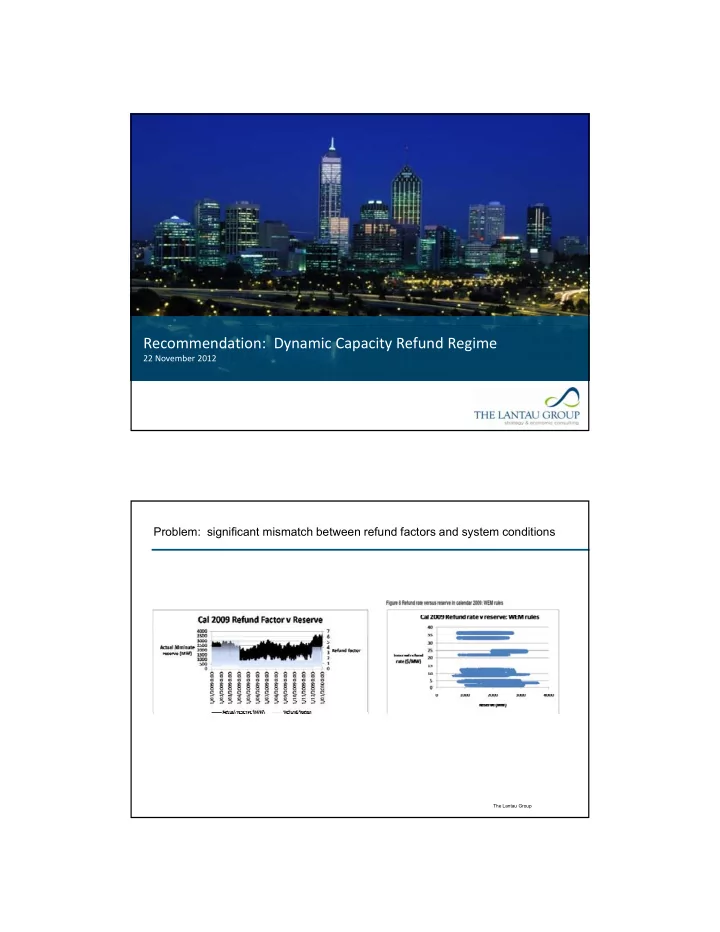
Problem: significant mismatch between refund factors and system conditions
The Lantau Group
Recommendation: Dynamic Capacity Refund Regime 22 November 2012 - - PDF document
Recommendation: Dynamic Capacity Refund Regime 22 November 2012 Problem: significant mismatch between refund factors and system conditions The Lantau Group Proposed solution: clarify purpose of refund regime and align incentives Dynamic
The Lantau Group
– Minimum refund factor to tie refund exposure to capacity credit value – Maximum refund factor linked to MRCP Fix distortions Improve incentive
– Rebates of refund revenue based on availability
– Offset RCR using 97 percent factor Revenue neutrality Sharper incentives Non-discriminatory
The Lantau Group
– Slope steepened to -3.75 from -3.25
– Contractual disposition of refunds not affected / rebates can still go to party exposed to refund – Eligibility for rebate corresponds to exposure to refund risk
2
3
The Lantau Group 4
– Penalty increases: Refund + Loss of rebate > Refund – Incentive emerges: Gain of rebate Capacity Resources Market Customers
– Better performance relative to average is rewarded – As average overall performance improves, standard gets tougher
Refunds no longer flow to Market customers Support RECYCLING Performance RCM Outcomes
The Lantau Group
– Refunds no longer flow to Market customers
5
– paid to units dispatched in times refunds are incurred, or – paid to units that are available
– Actual dispatch is the acid test of availability – But available resources have value, even if not dispatched
– Data does not support dispatch-based refunds
4.0% 5.0% 6.0% ge Rate
Load Factor vs FO Rate
The Lantau Group
– Aligns with purpose of RCM – No discrimination in contravention of Market Objectives
6 0.0% 1.0% 2.0% 3.0% 0.0% 20.0% 40.0% 60.0% 80.0% 100.0% 120.0% Foreced Outag Load Factor
80 100 120 pacity (MW)
150 200 pacity (MW)
100 120 MW)
35 40 MW)
20 40 60 1000 2000 3000 4000 5000 Forced Outage Cap Demand (MW) 50 100 1000 2000 3000 4000 5000 Forced Outage Cap Demand (MW)
The Lantau Group 7
20 40 60 80 100 1000 2000 3000 4000 5000 Forced Outage Capacity (M Demand (MW) 5 10 15 20 25 30 35 1000 2000 3000 4000 5000 Forced Outage Capacity (M Demand (MW)
% of hours Refund Factor 100% 1 75% 1 67% 1
5.00% 10.00% 15.00% Refund (‐),Rebate (+) & Net Exposure (as % of RCP) 8.0% 10.0% 12.0% 4.00% 6.00% 8.00% 10.00% 12.00%
Net Exposure (as % of RCP)
Baseload Peakers Baseload Peakers FLAT
50% 1 33% 1 25% 1 10% 1 5% 1 1% 1 Plant No. Net Capacity (MW) FOR (%) Load Factor (%) Availabili ty (%) Plant No. Net Capacity (MW) FOR (%) Load Factor (%) Availabili ty (%) 1 200 5.0% 80.0% 85.0% 14 200 5.0% 41.0% 85.0% 2 200 5.0% 77.0% 85.0% 15 200 5.0% 38.0% 85.0%
‐15.00% ‐10.00% ‐5.00% 0.00% 1 2 3 4 5 6 7 8 9 10 11 12 13 14 15 16 17 18 19 20 21 22 23 24 25 26 Refund/MW Min Max Rebate/MW Min Max Net Exposure/MW 0.0% 2.0% 4.0% 6.0% ‐8.00% ‐6.00% ‐4.00% ‐2.00% 0.00% 2.00% 1 2 3 4 5 6 7 8 9 10 11 12 13 14 15 16 17 18 19 20 21 22 23 24 25 26 Average (LHS) Min Max Failure Rate (RHS) 250% 300%
Rebate/MW (as % of unit refund)
Note: Planned Outages were
The Lantau Group 8
3 200 5.0% 74.0% 85.0% 16 200 5.0% 35.0% 85.0% 4 200 5.0% 71.0% 85.0% 17 200 5.0% 32.0% 85.0% 5 200 5.0% 68.0% 85.0% 18 200 5.0% 29.0% 85.0% 6 200 5.0% 65.0% 85.0% 19 200 5.0% 26.0% 85.0% 7 200 5.0% 62.0% 85.0% 20 200 5.0% 23.0% 85.0% 8 200 5.0% 59.0% 85.0% 21 200 5.0% 20.0% 85.0% 9 200 5.0% 56.0% 85.0% 22 200 5.0% 17.0% 85.0% 10 200 5.0% 53.0% 85.0% 23 200 5.0% 14.0% 85.0% 11 200 5.0% 50.0% 85.0% 24 200 5.0% 11.0% 85.0% 12 200 5.0% 47.0% 85.0% 25 200 5.0% 8.0% 85.0% 13 200 5.0% 44.0% 85.0% 26 200 5.0% 5.0% 85.0%
0% 50% 100% 150% 200% 1 293 585 877 1169 1461 1753 2045 2337 2629 2921 3213 3505 3797 4089 4381 4673 4965 5257 5549 5841 6133 6425 6717 7009 7301 7593 7885 8177 8469 Time (Peak ‐‐> Offpeak)
Note: Failure rate = FOR / Availability. Higher failure rate implies the chance that the facility would run into FO during its available period is higher.
g scheduled into lower 50% of load duration curve
5% 10% 15% Refund (‐),Rebate (+) & Net Exposure (as % of RCP) 8% 10% 12% 4% 6% 8% 10% 12%
Net Exposure (as % of RCP)
% of hours Refund Factor 100% 1 75% 1 67% 1
Baseload Peakers Baseload Peakers FLAT
‐15% ‐10% ‐5% 0% 1 2 3 4 5 6 7 8 9 10 11 12 13 14 15 16 17 18 19 20 21 22 23 24 25 26 Refund/MW Min Max Rebate/MW Min Max Net Exposure/MW 0% 2% 4% 6% ‐8% ‐6% ‐4% ‐2% 0% 2% 1 2 3 4 5 6 7 8 9 10 11 12 13 14 15 16 17 18 19 20 21 22 23 24 25 26 Average (LHS) Min Max Failure Rate (RHS) 250% 300%
Rebate/MW (as % of unit refund)
50% 1 33% 1 25% 1 10% 1 5% 1 1% 1 Plant No. Net Capacity (MW) FOR (%) Load Factor (%) Availabili ty (%) Plant No. Net Capacity (MW) FOR (%) Load Factor (%) Availabili ty (%) 1 200 5.0% 80.0% 85.0% 14 200 5.0% 41.0% 85.0% 2 200 5.0% 77.0% 85.0% 15 200 5.0% 38.0% 85.0%
The Lantau Group 0% 50% 100% 150% 200% 1 293 585 877 1169 1461 1753 2045 2337 2629 2921 3213 3505 3797 4089 4381 4673 4965 5257 5549 5841 6133 6425 6717 7009 7301 7593 7885 8177 8469 Time (Peak ‐‐> Offpeak) 9
3 200 5.0% 74.0% 85.0% 16 200 5.0% 35.0% 85.0% 4 200 5.0% 71.0% 85.0% 17 200 5.0% 32.0% 85.0% 5 200 5.0% 68.0% 85.0% 18 200 5.0% 29.0% 85.0% 6 200 5.0% 65.0% 85.0% 19 200 5.0% 26.0% 85.0% 7 200 5.0% 62.0% 85.0% 20 200 5.0% 23.0% 85.0% 8 200 5.0% 59.0% 85.0% 21 200 5.0% 20.0% 85.0% 9 200 5.0% 56.0% 85.0% 22 200 5.0% 17.0% 85.0% 10 200 5.0% 53.0% 85.0% 23 200 5.0% 14.0% 85.0% 11 200 5.0% 50.0% 85.0% 24 200 5.0% 11.0% 85.0% 12 200 5.0% 47.0% 85.0% 25 200 5.0% 8.0% 85.0% 13 200 5.0% 44.0% 85.0% 26 200 5.0% 5.0% 85.0% Note: Failure rate = FOR / Availability. Higher failure rate implies the chance that the facility would run into FO during its available period is higher.
% of hours Refund Factor 100% 75% 67%
5% 10% 15% Refund (‐),Rebate (+) & Net Exposure (as % of RCP) 8% 10% 12% 4% 6% 8% 10% 12%
Net Exposure (as % of RCP)
Baseload Peakers Baseload Peakers PROFILED
Plant No. Net Capacity (MW) FOR (%) Load Factor (%) Availabili ty (%) Plant No. Net Capacity (MW) FOR (%) Load Factor (%) Availabili ty (%) 1 200 5.0% 80.0% 85.0% 14 200 5.0% 41.0% 85.0% 2 200 5.0% 77.0% 85.0% 15 200 5.0% 38.0% 85.0% 50% 1 33% 2 25% 3 10% 4 5% 5 1% 6
‐15% ‐10% ‐5% 0% 1 2 3 4 5 6 7 8 9 10 11 12 13 14 15 16 17 18 19 20 21 22 23 24 25 26 Refund/MW Min Max Rebate/MW Min Max Net Exposure/MW 0% 2% 4% 6% ‐8% ‐6% ‐4% ‐2% 0% 2% 1 2 3 4 5 6 7 8 9 10 11 12 13 14 15 16 17 18 19 20 21 22 23 24 25 26 Average (LHS) Min Max Failure Rate (RHS) 250% 300%
Rebate/MW (as % of unit refund)
Hypothetical system of identical units with same FO and availability but different load factors The Lantau Group 10 3 200 5.0% 74.0% 85.0% 16 200 5.0% 35.0% 85.0% 4 200 5.0% 71.0% 85.0% 17 200 5.0% 32.0% 85.0% 5 200 5.0% 68.0% 85.0% 18 200 5.0% 29.0% 85.0% 6 200 5.0% 65.0% 85.0% 19 200 5.0% 26.0% 85.0% 7 200 5.0% 62.0% 85.0% 20 200 5.0% 23.0% 85.0% 8 200 5.0% 59.0% 85.0% 21 200 5.0% 20.0% 85.0% 9 200 5.0% 56.0% 85.0% 22 200 5.0% 17.0% 85.0% 10 200 5.0% 53.0% 85.0% 23 200 5.0% 14.0% 85.0% 11 200 5.0% 50.0% 85.0% 24 200 5.0% 11.0% 85.0% 12 200 5.0% 47.0% 85.0% 25 200 5.0% 8.0% 85.0% 13 200 5.0% 44.0% 85.0% 26 200 5.0% 5.0% 85.0%
0% 50% 100% 150% 200% 1 293 585 877 1169 1461 1753 2045 2337 2629 2921 3213 3505 3797 4089 4381 4673 4965 5257 5549 5841 6133 6425 6717 7009 7301 7593 7885 8177 8469 Time (Peak ‐‐> Offpeak)
Note: Failure rate = FOR / Availability. Higher failure rate implies the chance that the facility would run into FO during its available period is higher.
5% 10% 15% Refund (‐),Rebate (+) & Net Exposure (as % of RCP) 8% 10% 12% 4% 6% 8% 10% 12%
Net Exposure (as % of RCP)
% of hours Refund Factor 100% 75% 67%
SUPER PROFILED Baseload Peakers Baseload Peakers
Plant No. Net Capacity (MW) FOR (%) Load Factor (%) Availabili ty (%) Plant No. Net Capacity (MW) FOR (%) Load Factor (%) Availabili ty (%) 1 200 5.0% 80.0% 85.0% 14 200 5.0% 41.0% 85.0% 2 200 5.0% 77.0% 85.0% 15 200 5.0% 38.0% 85.0%
‐15% ‐10% ‐5% 0% 1 2 3 4 5 6 7 8 9 10 11 12 13 14 15 16 17 18 19 20 21 22 23 24 25 26 Refund/MW Min Max Rebate/MW Min Max Net Exposure/MW 0% 2% 4% 6% ‐8% ‐6% ‐4% ‐2% 0% 2% 1 2 3 4 5 6 7 8 9 10 11 12 13 14 15 16 17 18 19 20 21 22 23 24 25 26 Average (LHS) Min Max Failure Rate (RHS) 250% 300%
Rebate/MW (as % of unit refund)
50% 33% 25% 10% 10 5% 50 1% 100 Hypothetical system of identical units with same FO and availability but different load factors
The Lantau Group
3 200 5.0% 74.0% 85.0% 16 200 5.0% 35.0% 85.0% 4 200 5.0% 71.0% 85.0% 17 200 5.0% 32.0% 85.0% 5 200 5.0% 68.0% 85.0% 18 200 5.0% 29.0% 85.0% 6 200 5.0% 65.0% 85.0% 19 200 5.0% 26.0% 85.0% 7 200 5.0% 62.0% 85.0% 20 200 5.0% 23.0% 85.0% 8 200 5.0% 59.0% 85.0% 21 200 5.0% 20.0% 85.0% 9 200 5.0% 56.0% 85.0% 22 200 5.0% 17.0% 85.0% 10 200 5.0% 53.0% 85.0% 23 200 5.0% 14.0% 85.0% 11 200 5.0% 50.0% 85.0% 24 200 5.0% 11.0% 85.0% 12 200 5.0% 47.0% 85.0% 25 200 5.0% 8.0% 85.0% 13 200 5.0% 44.0% 85.0% 26 200 5.0% 5.0% 85.0%
11 0% 50% 100% 150% 200% 1 293 585 877 1169 1461 1753 2045 2337 2629 2921 3213 3505 3797 4089 4381 4673 4965 5257 5549 5841 6133 6425 6717 7009 7301 7593 7885 8177 8469 Time (Peak ‐‐> Offpeak) Note: Failure rate = FOR / Availability. Higher failure rate implies the chance that the facility would run into FO during its available period is higher.
% of hours Refund Factor 100% 75% 67%
5% 10% 15% Refund (‐),Rebate (+) & Net Exposure (as % of RCP) 8% 10% 12% 4% 6% 8% 10% 12%
Net Exposure (as % of RCP)
Baseload Peakers Baseload Peakers
Plant No. Net Capacity (MW) FOR (%) Load Factor (%) Availabili ty (%) Plant No. Net Capacity (MW) FOR (%) Load Factor (%) Availabili ty (%) 1 200 5.0% 80.0% 85.0% 14 200 5.0% 41.0% 85.0% 2 200 5.0% 77.0% 85.0% 15 200 5.0% 38.0% 85.0% 50% 1 33% 2 25% 3 10% 4 5% 5 1% 6
‐15% ‐10% ‐5% 0% 1 2 3 4 5 6 7 8 9 10 11 12 13 14 15 16 17 18 19 20 21 22 23 24 25 26 Refund/MW Min Max Rebate/MW Min Max Net Exposure/MW 0% 2% 4% 6% ‐8% ‐6% ‐4% ‐2% 0% 2% 1 2 3 4 5 6 7 8 9 10 11 12 13 14 15 16 17 18 19 20 21 22 23 24 25 26 Average (LHS) Min Max Failure Rate (RHS) 250% 300%
Rebate/MW (as % of unit refund)
Hypothetical system of identical units with same FO and availability but different load factors The Lantau Group 3 200 5.0% 74.0% 85.0% 16 200 5.0% 35.0% 85.0% 4 200 5.0% 71.0% 85.0% 17 200 5.0% 32.0% 85.0% 5 200 5.0% 68.0% 85.0% 18 200 5.0% 29.0% 85.0% 6 200 5.0% 65.0% 85.0% 19 200 5.0% 26.0% 85.0% 7 200 5.0% 62.0% 85.0% 20 200 5.0% 23.0% 85.0% 8 200 5.0% 59.0% 85.0% 21 200 5.0% 20.0% 85.0% 9 200 5.0% 56.0% 85.0% 22 200 5.0% 17.0% 85.0% 10 200 5.0% 53.0% 85.0% 23 200 5.0% 14.0% 85.0% 11 200 5.0% 50.0% 85.0% 24 200 5.0% 11.0% 85.0% 12 200 5.0% 47.0% 85.0% 25 200 5.0% 8.0% 85.0% 13 200 5.0% 44.0% 85.0% 26 200 5.0% 5.0% 85.0% 12
0% 50% 100% 150% 200% 1 293 585 877 1169 1461 1753 2045 2337 2629 2921 3213 3505 3797 4089 4381 4673 4965 5257 5549 5841 6133 6425 6717 7009 7301 7593 7885 8177 8469 Time (Peak ‐‐> Offpeak)
Note: Failure rate = FOR / Availability. Higher failure rate implies the chance that the facility would run into FO during its available period is higher.
– Because FO risk is not tightly correlated to dispatch (according to the data), there is no sufficient nexus between dispatch and the “earning” of a rebate for avoiding a FO – Instead, “earning” a rebate requires being available and not on FO
Reducing the amount of excess reserve capacity
The Lantau Group
– Reducing the amount of excess reserve capacity – Testing and validation processes
13
– Option A – IMO Proposal Option A IMO Proposal – Option B – Modified IMO Proposal with minimum refund factor – Option C – Option B with MRCP-linked maximum refund factors
The Lantau Group 14
– a capped refund factor that would apply whenever the reserve capacity is below the required minimum reserve used by System Management in outage OPTION A reserve used by System Management in outage planning, say 2*min reserve ~ 750MW; – a lower minimum floor level to apply once reserve rises to more than a nominated factor above the minimum capacity requirement be set equal to 4* min reserve ~ 1500MW; and – a final break point set such that the refund factor is zero when reserve is greater than 6 * min reserve ~ 2000MW. – the cap on cumulative refunds and translation factor,
reserve capacity>= 1500 MW 93.4% of time
The Lantau Group
p , Y, is retained
15
Y = Annual Reserve Capacity Price / 12 months / Number
Interval Refund rate ($/MW) = Refund factor * Y Reserve Capacity = Capacity Credits – Demand – Planned Outage – Forced Outage
– Implements dynamic refund factors that reflect system conditions
– A larger spread of refund factors would better reflect the economic value implications of OPTION A system conditions – Significant improvement on existing time-based arrangements (as noted in previous meetings) reflect the economic value implications of differing reserve capacity levels in real time – Possible gaming under extreme conditions
some of its capacity payment revenue if refund factors are low enough
– Inconsistent treatment of similar situations
th l f TI f d ill b R f d F t * Y
The Lantau Group 16
the value of a TI refund will be Refund Factor * Y, where Y reflects each year’s RCP
should not the refund exposure be the same – only the probability of hitting that exposure should be different
– Refund factors can be zero or less than 1 for substantial portions of the year – Higher factors may not occur enough to cause sum-of-factors to claw back full CP value OPTION A
– Sufficient excess reserve capacity – Few other planned and forced outages (so refund factors are minimised)
– Lower RCP when more excess reserve capacity reduces benefit of strategy
The Lantau Group
– Ignore – small probability / cannot be assured (strategy of exploitation is not without significant risk) – Set minimum conditions for retention of capacity credit value – Set minimum refund factors to prevent situation from being possible
17
20% ‐10% 0% 10% 1 2 3 4 5 6 7 8 9 10 11 12 13 14 15 16 17 18 19 20 21 22 23 24 25 26
Refund (‐),Rebate (+) & Net Exposure (as % of RCP)
6% 7% 8% 9% 10% ‐10% 0% 10% 1 2 3 4 5 6 7 8 9 10 11 12 13 14 15 16 17 18 19 20 21 22 23 24 25 26
Net Exposure (as % of RCP)
5% Excess capacity OPTION A
‐60% ‐50% ‐40% ‐30% ‐20% Refund/MW Min Max Rebate/MW Min Max Net Exposure/MW 0% 1% 2% 3% 4% 5% 6% ‐60% ‐50% ‐40% ‐30% ‐20% Average (LHS) Min Max Failure Rate (RHS) 250% 300%
Rebate/MW (as % of unit refund)
16 18 20
Refund Factor
Retains about 50%, despite full year outage
The Lantau Group 0% 50% 100% 150% 200% 1 275 549 823 1097 1371 1645 1919 2193 2467 2741 3015 3289 3563 3837 4111 4385 4659 4933 5207 5481 5755 6029 6303 6577 6851 7125 7399 7673 7947 8221 8495 2 4 6 8 10 12 14 16 1 275 549 823 1097 1371 1645 1919 2193 2467 2741 3015 3289 3563 3837 4111 4385 4659 4933 5207 5481 5755 6029 6303 6577 6851 7125 7399 7673 7947 8221 8495 18
Refund factors are not high enough for enough trading intervals to claw back value
6 7
Modified IMO Proposal Original IMO Proposal OPTION B
1 2 3 4 5 1000 2000 3000 4000 5000 6000 Reserve Capacity (MW)
The Lantau Group
– Impossible to avoid refund exposure or full clawback for complete non-performance – Signals that any period is potentially a value period, so reduces incentive to game FO into ultra low periods – improving truthful declaration
– Exposure to refunds, even in low value periods – Reduces “spread” between highest refund factor period and lowest – dulling the overall incentive mildly
19
14 16 18 20
20%
– Annual Maximum refund factor is linked to ratio
MAX[yr] = MRCP / RCP * CONSTANT SCALING FACTOR (10)
OPTION C
2 4 6 8 10 12 14
500 1000 1500 2000 2500
Refund Factor Reserve Capacity (MW) 20% 15.0% 10.0% 5.0% 0.0% ‐5.0% IMO
Annual Maximum refund factor is linked to ratio
– Linear with no cap – so potentially higher refund risk in an excess capacity world
The Lantau Group 20
Principle: TI refund risk should be similar for similar reserve levels over time unless MRCP has changed
No matter what the excess capacity is for the year (reflected in the RCP), at the point of zero reserve capacity in a TI, the refund exposure per MW should be linked to the MRCP / TI
OPTION C
– Reduces financial risk related to year to year changes in the RCP due to changes in excess reserve capacity – Increases performance incentive related to availability incentive
The Lantau Group
– The constant scalar factor (10) can be selected to manage overall financial risk – current selection is “10”, which approximates uncapped slope in the IMO DR proposal
21
22
Refund Regime IMO with Floor 1 Availiability or Dispatched Based Rebate Availability Excess Capacity 5% Maximum Reserve Capacity Price ($/MW) 163900 Reserve Capacity Price ($/MW) 138021 Unit Refund ($/MWh) 15.76 138685 Refund Regime IMO with Floor 1 Availiability or Dispatched Based Rebate Availability Excess Capacity 15% Maximum Reserve Capacity Price ($/MW) 163900 Reserve Capacity Price ($/MW) 104896 Unit Refund ($/MWh) 11.97 107636
Plant No. Net Capacity (MW) FOR (%) Load Factor (%) Availabili ty (%) Plant No. Net Capacity (MW) FOR (%) Load Factor (%) Availability (%) 1 320 1.0% 90.0% 91.0% 14 40 1.0% 52.3% 96.0% 2 200 3.0% 85.0% 88.0% 15 320 0.2% 48.8% 95.0% 3 100 100.0% 0.0% 100.0% 16 200 1.0% 9.7% 50.0% 4 100 1.0% 97.0% 98.0% 17 200 0.5% 13.4% 65.0% 5 100 0.2% 94.8% 95.0% 18 100 0.1% 11.1% 95.0% 6 320 0.5% 89.5% 90.0% 19 40 0.1% 7.8% 90.0% 7 40 0.5% 94.5% 95.0% 20 200 0.5% 6.7% 98.0% 8 20 6.0% 74.1% 80.0% 21 100 1.0% 3.2% 99.0% 9 200 6.0% 63.9% 70.0% 22 40 0.2% 2.0% 95.0% 10 200 1.0% 77.7% 85.0% 23 200 3.0% 1.5% 98.0% 11 20 1.0% 75.2% 95.0% 24 100 0.1% 0.6% 50.0% 12 200 0.2% 70.4% 90.0% 25 20 2.0% 0.2% 80.0% 13 100 0.5% 50.7% 80.0% 26 50 0.5% 0.0% 25.0% Plant No. Net Capacity (MW) FOR (%) Load Factor (%) Availabili ty (%) Plant No. Net Capacity (MW) FOR (%) Load Factor (%) Availability (%) 1 320 1.0% 90.0% 91.0% 14 40 1.0% 36.9% 96.0% 2 200 3.0% 85.0% 88.0% 15 320 0.2% 33.4% 95.0% 3 100 100.0% 0.0% 100.0% 16 200 1.0% 6.7% 50.0% 4 100 1.0% 97.0% 98.0% 17 200 0.5% 6.7% 65.0% 5 100 0.2% 94.8% 95.0% 18 100 0.1% 6.5% 95.0% 6 320 0.5% 89.5% 90.0% 19 40 0.1% 4.6% 90.0% 7 40 0.5% 93.4% 95.0% 20 200 0.5% 3.9% 98.0% 8 20 6.0% 71.4% 80.0% 21 100 1.0% 1.6% 99.0% 9 200 6.0% 61.6% 70.0% 22 40 0.2% 0.9% 95.0% 10 200 1.0% 71.1% 85.0% 23 200 3.0% 0.6% 98.0% 11 20 1.0% 65.0% 95.0% 24 100 0.1% 0.2% 50.0% 12 200 0.2% 59.5% 90.0% 25 20 2.0% 0.1% 80.0% 13 100 0.5% 39.3% 80.0% 26 50 0.5% 0.0% 25.0% N t L d N t L d
Unit 3 on Full-Year FO Excess Reserve Capacity = 15% Unit 3 on Full-Year (100%) FO Excess Reserve Capacity = 5%
The Lantau Group 23 Plant No. Net Capacity (MW) FOR (%) Load Factor (%) Availabili ty (%) Plant No. Net Capacity (MW) FOR (%) Load Factor (%) Availability (%) 1 320 1.0% 90.0% 91.0% 14 40 1.0% 30.5% 96.0% 2 200 3.0% 85.0% 88.0% 15 320 0.2% 27.3% 95.0% 3 100 10.0% 79.8% 90.0% 16 200 1.0% 4.2% 50.0% 4 100 1.0% 97.0% 98.0% 17 200 0.5% 5.7% 65.0% 5 100 0.2% 94.8% 95.0% 18 100 0.1% 4.6% 95.0% 6 320 0.5% 89.5% 90.0% 19 40 0.1% 3.0% 90.0% 7 40 0.5% 87.6% 95.0% 20 200 0.5% 2.6% 98.0% 8 20 6.0% 67.9% 80.0% 21 100 1.0% 1.0% 99.0% 9 200 6.0% 57.1% 70.0% 22 40 0.2% 0.6% 95.0% 10 200 1.0% 64.4% 85.0% 23 200 3.0% 0.4% 98.0% 11 20 1.0% 57.3% 95.0% 24 100 0.1% 0.2% 50.0% 12 200 0.2% 52.7% 90.0% 25 20 2.0% 0.0% 80.0% 13 100 0.5% 32.0% 80.0% 26 50 0.5% 0.0% 25.0% Plant No. Net Capacity (MW) FOR (%) Load Factor (%) Availabili ty (%) Plant No. Net Capacity (MW) FOR (%) Load Factor (%) Availability (%) 1 320 1.0% 90.1% 91.0% 14 40 1.0% 44.2% 96.0% 2 200 3.0% 85.0% 88.0% 15 320 0.2% 40.8% 95.0% 3 100 10.0% 79.8% 90.0% 16 200 1.0% 8.7% 50.0% 4 100 1.0% 97.0% 98.0% 17 200 0.5% 8.5% 65.0% 5 100 0.2% 94.8% 95.0% 18 100 0.1% 8.1% 95.0% 6 320 0.5% 89.5% 90.0% 19 40 0.1% 5.8% 90.0% 7 40 0.5% 93.8% 95.0% 20 200 0.5% 5.0% 98.0% 8 20 6.0% 72.6% 80.0% 21 100 1.0% 2.3% 99.0% 9 200 6.0% 62.7% 70.0% 22 40 0.2% 1.5% 95.0% 10 200 1.0% 73.5% 85.0% 23 200 3.0% 1.0% 98.0% 11 20 1.0% 69.7% 95.0% 24 100 0.1% 0.4% 50.0% 12 200 0.2% 64.5% 90.0% 25 20 2.0% 0.2% 80.0% 13 100 0.5% 45.1% 80.0% 26 50 0.5% 0.0% 25.0%
Unit 3 on Normal (10%) FO Excess Reserve Capacity = 15% Unit 3 on Normal (10%) FO Excess Reserve Capacity = 5%
10% 20% 30%
Refund (‐),Rebate (+) & Net Exposure (as % of RCP)
6% 7% 8% 9% 10% 10% 20% 30%
Net Exposure (as % of RCP)
Unit 3 on Full-Year (100%) FO Excess Reserve Capacity = 5%
‐30% ‐20% ‐10% 0% 1 2 3 4 5 6 7 8 9 10 11 12 13 14 15 16 17 18 19 20 21 22 23 24 25 26 Refund/MW Min Max Rebate/MW Min Max Net Exposure/MW 0% 1% 2% 3% 4% 5% 6% ‐30% ‐20% ‐10% 0% 1 2 3 4 5 6 7 8 9 10 11 12 13 14 15 16 17 18 19 20 21 22 23 24 25 26 Average (LHS) Min Max Failure Rate (RHS) 250% 300%
Rebate/MW (as % of unit refund)
16 18 20
Refund Factor
The Lantau Group 24 0% 50% 100% 150% 200% 1 275 549 823 1097 1371 1645 1919 2193 2467 2741 3015 3289 3563 3837 4111 4385 4659 4933 5207 5481 5755 6029 6303 6577 6851 7125 7399 7673 7947 8221 8495 2 4 6 8 10 12 14 16 1 275 549 823 1097 1371 1645 1919 2193 2467 2741 3015 3289 3563 3837 4111 4385 4659 4933 5207 5481 5755 6029 6303 6577 6851 7125 7399 7673 7947 8221 8495
10% 20% 30%
Refund (‐),Rebate (+) & Net Exposure (as % of RCP)
6% 7% 8% 9% 10% 10% 20% 30%
Net Exposure (as % of RCP)
Unit 3 on Full-Year (100%) FO Excess Reserve Capacity = 15%
‐30% ‐20% ‐10% 0% 1 2 3 4 5 6 7 8 9 10 11 12 13 14 15 16 17 18 19 20 21 22 23 24 25 26 Refund/MW Min Max Rebate/MW Min Max Net Exposure/MW 0% 1% 2% 3% 4% 5% 6% ‐30% ‐20% ‐10% 0% 1 2 3 4 5 6 7 8 9 10 11 12 13 14 15 16 17 18 19 20 21 22 23 24 25 26 Average (LHS) Min Max Failure Rate (RHS) 250% 300%
Rebate/MW (as % of unit refund)
16 18 20
Refund Factor
The Lantau Group 25 0% 50% 100% 150% 200% 1 275 549 823 1097 1371 1645 1919 2193 2467 2741 3015 3289 3563 3837 4111 4385 4659 4933 5207 5481 5755 6029 6303 6577 6851 7125 7399 7673 7947 8221 8495 2 4 6 8 10 12 14 16 1 275 549 823 1097 1371 1645 1919 2193 2467 2741 3015 3289 3563 3837 4111 4385 4659 4933 5207 5481 5755 6029 6303 6577 6851 7125 7399 7673 7947 8221 8495
Unit 3 on Normal (10%) FO Excess Reserve Capacity = 5%
10% 20% 30%
Refund (‐),Rebate (+) & Net Exposure (as % of RCP)
6% 7% 8% 9% 10% 10% 20% 30%
Net Exposure (as % of RCP)
‐30% ‐20% ‐10% 0% 1 2 3 4 5 6 7 8 9 10 11 12 13 14 15 16 17 18 19 20 21 22 23 24 25 26 Refund/MW Min Max Rebate/MW Min Max Net Exposure/MW 0% 1% 2% 3% 4% 5% 6% ‐30% ‐20% ‐10% 0% 1 2 3 4 5 6 7 8 9 10 11 12 13 14 15 16 17 18 19 20 21 22 23 24 25 26 Average (LHS) Min Max Failure Rate (RHS) 250% 300%
Rebate/MW (as % of unit refund)
16 18 20
Refund Factor
The Lantau Group 26 0% 50% 100% 150% 200% 1 275 549 823 1097 1371 1645 1919 2193 2467 2741 3015 3289 3563 3837 4111 4385 4659 4933 5207 5481 5755 6029 6303 6577 6851 7125 7399 7673 7947 8221 8495 2 4 6 8 10 12 14 16 1 275 549 823 1097 1371 1645 1919 2193 2467 2741 3015 3289 3563 3837 4111 4385 4659 4933 5207 5481 5755 6029 6303 6577 6851 7125 7399 7673 7947 8221 8495
Unit 3 on Normal (10%) FO Excess Reserve Capacity = 15%
10% 20% 30%
Refund (‐),Rebate (+) & Net Exposure (as % of RCP)
6% 7% 8% 9% 10% 10% 20% 30%
Net Exposure (as % of RCP)
‐30% ‐20% ‐10% 0% 1 2 3 4 5 6 7 8 9 10 11 12 13 14 15 16 17 18 19 20 21 22 23 24 25 26 Refund/MW Min Max Rebate/MW Min Max Net Exposure/MW 0% 1% 2% 3% 4% 5% 6% ‐30% ‐20% ‐10% 0% 1 2 3 4 5 6 7 8 9 10 11 12 13 14 15 16 17 18 19 20 21 22 23 24 25 26 Average (LHS) Min Max Failure Rate (RHS) 250% 300%
Rebate/MW (as % of unit refund)
16 18 20
Refund Factor
The Lantau Group 27 0% 50% 100% 150% 200% 1 275 549 823 1097 1371 1645 1919 2193 2467 2741 3015 3289 3563 3837 4111 4385 4659 4933 5207 5481 5755 6029 6303 6577 6851 7125 7399 7673 7947 8221 8495 2 4 6 8 10 12 14 16 1 275 549 823 1097 1371 1645 1919 2193 2467 2741 3015 3289 3563 3837 4111 4385 4659 4933 5207 5481 5755 6029 6303 6577 6851 7125 7399 7673 7947 8221 8495
10% 20% 30%
Refund (‐),Rebate (+) & Net Exposure (as % of RCP)
6% 7% 8% 9% 10% 10% 20% 30%
Net Exposure (as % of RCP)
Unit 3 on Full-Year (100%) FO Excess Reserve Capacity = 5%
‐30% ‐20% ‐10% 0% 1 2 3 4 5 6 7 8 9 10 11 12 13 14 15 16 17 18 19 20 21 22 23 24 25 26 Refund/MW Min Max Rebate/MW Min Max Net Exposure/MW 0% 1% 2% 3% 4% 5% 6% ‐30% ‐20% ‐10% 0% 1 2 3 4 5 6 7 8 9 10 11 12 13 14 15 16 17 18 19 20 21 22 23 24 25 26 Average (LHS) Min Max Failure Rate (RHS) 250% 300%
Rebate/MW (as % of unit refund)
16 18 20
Refund Factor
The Lantau Group 28 0% 50% 100% 150% 200% 1 275 549 823 1097 1371 1645 1919 2193 2467 2741 3015 3289 3563 3837 4111 4385 4659 4933 5207 5481 5755 6029 6303 6577 6851 7125 7399 7673 7947 8221 8495 2 4 6 8 10 12 14 16 1 275 549 823 1097 1371 1645 1919 2193 2467 2741 3015 3289 3563 3837 4111 4385 4659 4933 5207 5481 5755 6029 6303 6577 6851 7125 7399 7673 7947 8221 8495
10% 20% 30%
Refund (‐),Rebate (+) & Net Exposure (as % of RCP)
6% 7% 8% 9% 10% 10% 20% 30%
Net Exposure (as % of RCP)
Unit 3 on Full-Year (100%) FO Excess Reserve Capacity = 15%
‐30% ‐20% ‐10% 0% 1 2 3 4 5 6 7 8 9 10 11 12 13 14 15 16 17 18 19 20 21 22 23 24 25 26 Refund/MW Min Max Rebate/MW Min Max Net Exposure/MW 0% 1% 2% 3% 4% 5% 6% ‐30% ‐20% ‐10% 0% 1 2 3 4 5 6 7 8 9 10 11 12 13 14 15 16 17 18 19 20 21 22 23 24 25 26 Average (LHS) Min Max Failure Rate (RHS) 250% 300%
Rebate/MW (as % of unit refund)
16 18 20
Refund Factor
The Lantau Group 29 0% 50% 100% 150% 200% 1 275 549 823 1097 1371 1645 1919 2193 2467 2741 3015 3289 3563 3837 4111 4385 4659 4933 5207 5481 5755 6029 6303 6577 6851 7125 7399 7673 7947 8221 8495 2 4 6 8 10 12 14 16 1 275 549 823 1097 1371 1645 1919 2193 2467 2741 3015 3289 3563 3837 4111 4385 4659 4933 5207 5481 5755 6029 6303 6577 6851 7125 7399 7673 7947 8221 8495
10% 20% 30%
Refund (‐),Rebate (+) & Net Exposure (as % of RCP)
6% 7% 8% 9% 10% 10% 20% 30%
Net Exposure (as % of RCP)
Unit 3 on Normal (10%) FO Excess Reserve Capacity = 5%
‐30% ‐20% ‐10% 0% 1 2 3 4 5 6 7 8 9 10 11 12 13 14 15 16 17 18 19 20 21 22 23 24 25 26 Refund/MW Min Max Rebate/MW Min Max Net Exposure/MW 0% 1% 2% 3% 4% 5% 6% ‐30% ‐20% ‐10% 0% 1 2 3 4 5 6 7 8 9 10 11 12 13 14 15 16 17 18 19 20 21 22 23 24 25 26 Average (LHS) Min Max Failure Rate (RHS) 250% 300%
Rebate/MW (as % of unit refund)
16 18 20
Refund Factor
The Lantau Group 30 0% 50% 100% 150% 200% 1 275 549 823 1097 1371 1645 1919 2193 2467 2741 3015 3289 3563 3837 4111 4385 4659 4933 5207 5481 5755 6029 6303 6577 6851 7125 7399 7673 7947 8221 8495 2 4 6 8 10 12 14 16 1 275 549 823 1097 1371 1645 1919 2193 2467 2741 3015 3289 3563 3837 4111 4385 4659 4933 5207 5481 5755 6029 6303 6577 6851 7125 7399 7673 7947 8221 8495
10% 20% 30%
Refund (‐),Rebate (+) & Net Exposure (as % of RCP)
6% 7% 8% 9% 10% 10% 20% 30%
Net Exposure (as % of RCP)
Unit 3 on Normal (10%) FO Excess Reserve Capacity = 15%
‐30% ‐20% ‐10% 0% 1 2 3 4 5 6 7 8 9 10 11 12 13 14 15 16 17 18 19 20 21 22 23 24 25 26 Refund/MW Min Max Rebate/MW Min Max Net Exposure/MW 0% 1% 2% 3% 4% 5% 6% ‐30% ‐20% ‐10% 0% 1 2 3 4 5 6 7 8 9 10 11 12 13 14 15 16 17 18 19 20 21 22 23 24 25 26 Average (LHS) Min Max Failure Rate (RHS) 250% 300%
Rebate/MW (as % of unit refund)
16 18 20
Refund Factor
The Lantau Group 31 0% 50% 100% 150% 200% 1 275 549 823 1097 1371 1645 1919 2193 2467 2741 3015 3289 3563 3837 4111 4385 4659 4933 5207 5481 5755 6029 6303 6577 6851 7125 7399 7673 7947 8221 8495 2 4 6 8 10 12 14 16 1 275 549 823 1097 1371 1645 1919 2193 2467 2741 3015 3289 3563 3837 4111 4385 4659 4933 5207 5481 5755 6029 6303 6577 6851 7125 7399 7673 7947 8221 8495
The Lantau Group 32
The Lantau Group 33
10% 20% 30%
Refund (‐),Rebate (+) & Net Exposure (as % of RCP)
6% 7% 8% 9% 10% 10% 20% 30%
Net Exposure (as % of RCP)
Unit 3 on Full-Year (100%) FO Excess Reserve Capacity = 5%
‐30% ‐20% ‐10% 0% 1 2 3 4 5 6 7 8 9 10 11 12 13 14 15 16 17 18 19 20 21 22 23 24 25 26 Refund/MW Min Max Rebate/MW Min Max Net Exposure/MW 0% 1% 2% 3% 4% 5% 6% ‐30% ‐20% ‐10% 0% 1 2 3 4 5 6 7 8 9 10 11 12 13 14 15 16 17 18 19 20 21 22 23 24 25 26 Average (LHS) Min Max Failure Rate (RHS) 250% 300%
Rebate/MW (as % of unit refund)
16 18 20
Refund Factor
The Lantau Group 34 0% 50% 100% 150% 200% 1 275 549 823 1097 1371 1645 1919 2193 2467 2741 3015 3289 3563 3837 4111 4385 4659 4933 5207 5481 5755 6029 6303 6577 6851 7125 7399 7673 7947 8221 8495 2 4 6 8 10 12 14 16 1 275 549 823 1097 1371 1645 1919 2193 2467 2741 3015 3289 3563 3837 4111 4385 4659 4933 5207 5481 5755 6029 6303 6577 6851 7125 7399 7673 7947 8221 8495
10% 20% 30%
Refund (‐),Rebate (+) & Net Exposure (as % of RCP)
6% 7% 8% 9% 10% 10% 20% 30%
Net Exposure (as % of RCP)
Unit 3 on Full-Year (100%) FO Excess Reserve Capacity = 15%
‐30% ‐20% ‐10% 0% 1 2 3 4 5 6 7 8 9 10 11 12 13 14 15 16 17 18 19 20 21 22 23 24 25 26 Refund/MW Min Max Rebate/MW Min Max Net Exposure/MW 0% 1% 2% 3% 4% 5% 6% ‐30% ‐20% ‐10% 0% 1 2 3 4 5 6 7 8 9 10 11 12 13 14 15 16 17 18 19 20 21 22 23 24 25 26 Average (LHS) Min Max Failure Rate (RHS) 250% 300%
Rebate/MW (as % of unit refund)
16 18 20
Refund Factor
The Lantau Group 35 0% 50% 100% 150% 200% 1 275 549 823 1097 1371 1645 1919 2193 2467 2741 3015 3289 3563 3837 4111 4385 4659 4933 5207 5481 5755 6029 6303 6577 6851 7125 7399 7673 7947 8221 8495 2 4 6 8 10 12 14 16 1 275 549 823 1097 1371 1645 1919 2193 2467 2741 3015 3289 3563 3837 4111 4385 4659 4933 5207 5481 5755 6029 6303 6577 6851 7125 7399 7673 7947 8221 8495
10% 20% 30%
Refund (‐),Rebate (+) & Net Exposure (as % of RCP)
6% 7% 8% 9% 10% 10% 20% 30%
Net Exposure (as % of RCP)
Unit 3 on Normal (10%) FO Excess Reserve Capacity = 5%
‐30% ‐20% ‐10% 0% 1 2 3 4 5 6 7 8 9 10 11 12 13 14 15 16 17 18 19 20 21 22 23 24 25 26 Refund/MW Min Max Rebate/MW Min Max Net Exposure/MW 0% 1% 2% 3% 4% 5% 6% ‐30% ‐20% ‐10% 0% 1 2 3 4 5 6 7 8 9 10 11 12 13 14 15 16 17 18 19 20 21 22 23 24 25 26 Average (LHS) Min Max Failure Rate (RHS) 250% 300%
Rebate/MW (as % of unit refund)
16 18 20
Refund Factor
The Lantau Group 36 0% 50% 100% 150% 200% 1 275 549 823 1097 1371 1645 1919 2193 2467 2741 3015 3289 3563 3837 4111 4385 4659 4933 5207 5481 5755 6029 6303 6577 6851 7125 7399 7673 7947 8221 8495 2 4 6 8 10 12 14 16 1 275 549 823 1097 1371 1645 1919 2193 2467 2741 3015 3289 3563 3837 4111 4385 4659 4933 5207 5481 5755 6029 6303 6577 6851 7125 7399 7673 7947 8221 8495
10% 20% 30%
Refund (‐),Rebate (+) & Net Exposure (as % of RCP)
6% 7% 8% 9% 10% 10% 20% 30%
Net Exposure (as % of RCP)
Unit 3 on Normal (10%) FO Excess Reserve Capacity = 15%
‐30% ‐20% ‐10% 0% 1 2 3 4 5 6 7 8 9 10 11 12 13 14 15 16 17 18 19 20 21 22 23 24 25 26 Refund/MW Min Max Rebate/MW Min Max Net Exposure/MW 0% 1% 2% 3% 4% 5% 6% ‐30% ‐20% ‐10% 0% 1 2 3 4 5 6 7 8 9 10 11 12 13 14 15 16 17 18 19 20 21 22 23 24 25 26 Average (LHS) Min Max Failure Rate (RHS) 250% 300%
Rebate/MW (as % of unit refund)
16 18 20
Refund Factor
The Lantau Group 37 0% 50% 100% 150% 200% 1 275 549 823 1097 1371 1645 1919 2193 2467 2741 3015 3289 3563 3837 4111 4385 4659 4933 5207 5481 5755 6029 6303 6577 6851 7125 7399 7673 7947 8221 8495 2 4 6 8 10 12 14 16 1 275 549 823 1097 1371 1645 1919 2193 2467 2741 3015 3289 3563 3837 4111 4385 4659 4933 5207 5481 5755 6029 6303 6577 6851 7125 7399 7673 7947 8221 8495
The Lantau Group
38
Option Excess Reserve Capacity Unit 3 FO Status Variance in Net Refunds Standard Deviation in Net Refund % Max Positive Net Refund% Min Positive Net Refund% Average Positive Net Refund% Average Negative Net Refund% Max Negative Net Refund Min Negative Net Refund Average Net Refund
(Unweighted)
IMO DR 5% Full Year 4.4% 21.0% 8.5% 0.1% 5.6%
5% Normal 0.4% 6.5% 4.8% 0.1% 3.0%
0.0% 15% Full Year 4.3% 20.7% 7.7% 0.0% 4.9%
15% Normal 0.2% 4.8% 4.0% 0.1% 2.2%
0.1% IMO DR MIN 1 5% Full Year 4.5% 21.3% 9.2% 0.5% 5.9%
5% Normal 0.6% 7.8% 5.8% 0.0% 3.5%
15% Full Year 4.4% 21.0% 8.2% 0.6% 5.5%
15% Normal 0.4% 6.4% 4.7% 0.1% 2.9%
0.0% RCP- Linked MIN 1 5% Full Year 4.7% 21.7% 10.4% 0.9% 6.9%
5% Normal 0.8% 8.8% 6.6% 0.1% 4.1%
0.0% 15% Full Year 4.7% 21.7% 10.5% 1.4% 7.0%
15% Normal 0.8% 8.7% 6.7% 0.1% 4.0%
0.1%
The Lantau Group
Current 5% Full Year 3.8% 19.4%
5% Normal 0.1% 3.0%
15% Full Year 3.8% 19.4%
15% Normal 0.1% 3.0%
39
Option Excess Reserve Capacity Unit 3 FO Status Unit 1 Unit 2 Unit 3 Unit 4 Unit 5 Unit 6 Unit 7 Unit 8 Unit 9 Unit 10 Unit 11 Unit 12 Unit 13 MW 320 200 100 100 100 320 40 20 200 200 20 200 100
Average FO Rate with Unit 3 on 100% FO
4.0% 4.0% 4.0% 4.0% 4.0% 4.0% 4.0% 4.0% 4.0% 4.0% 4.0% 4.0% 4.0%
Average FO Rate with Unit 3 on 10% FO
1.5% 1.5% 1.5% 1.5% 1.5% 1.5% 1.5% 1.5% 1.5% 1.5% 1.5% 1.5% 1.5% FO 1 0% 3 0% VARIES 1 0% 0 2% 0 5% 0 5% 6 0% 6 0% 1 0% 1 0% 0 2% 0 5% FO 1.0% 3.0% VARIES 1.0% 0.2% 0.5% 0.5% 6.0% 6.0% 1.0% 1.0% 0.2% 0.5% PO 9.0% 12.0% 10.0% 2.0% 5.0% 10.0% 5.0% 20.0% 30.0% 15.0% 5.0% 10.0% 20.0% IMO DR 5% Full Year 2.9%
5.8% 8.2% 5.4% 7.5%
3.6% 5.9% 6.9% 5.6% 5% Normal 0.9%
2.7% 4.5% 2.5% 4.1%
1.2% 2.7% 3.9% 3.0% 15% Full Year 2.7%
5.5% 7.2% 5.0% 6.7%
2.9% 5.5% 6.1% 5.2% 15% Normal 0.5%
2.0% 3.6% 1.9% 3.1%
0.9% 2.4% 3.0% 2.2% Std Deviation 1.2% 1.1% 46.8% 1.9% 2.2% 1.8% 2.1% 2.4% 1.9% 1.3% 1.8% 1.8% 1.7% Average 1.8%
4.0% 5.9% 3.7% 5.3%
2.2% 4.1% 5.0% 4.0% IMO DR MIN 1 5% Full Year 3.4%
6.1% 8.7% 5.5% 7.8%
3.6% 6.0% 7.6% 5.6% 5% Normal 1.3%
2.9% 5.3% 3.1% 4.6%
1.5% 3.2% 4.8% 3.3% 15% Full Year 3.1%
5.6% 7.8% 5.2% 6.9%
3.5% 5.8% 6.6% 5.5% 15% Normal 1.1%
2.4% 4.2% 2.6% 3.8%
1.3% 2.7% 3.8% 2.6% Std Deviation 1.2% 1.0% 43.4% 1.9% 2.1% 1.5% 1.9% 1.5% 2.2% 1.2% 1.7% 1.7% 1.5% Average 2.2%
4.2% 6.5% 4.1% 5.8%
2.5% 4.4% 5.7% 4.3% RCP- Linked MIN 1 5% Full Year 3.2%
6.3% 9.6% 6.1% 8.9%
3.5% 6.9% 8.4% 6.8% 5% Normal 1.7%
3.5% 6.2% 3.5% 5.3%
1.7% 3.6% 5.4% 3.8% 15% Full Year 2.8%
6.7% 9.9% 6.1% 9.2%
2.8% 7.2% 8.4% 7.0% 15% Normal 0 7% 6 3% 29 8% 3 4% 6 1% 3 7% 5 5% 12 9% 19 2% 1 5% 3 8% 5 3% 3 7% The Lantau Group 15% Normal 0.7%
3.4% 6.1% 3.7% 5.5%
1.5% 3.8% 5.3% 3.7% Std Deviation 1.1% 0.9% 40.6% 1.8% 2.1% 1.4% 2.1% 0.4% 1.3% 0.9% 1.9% 1.8% 1.8% Average 2.1%
5.0% 7.9% 4.8% 7.2%
2.4% 5.4% 6.9% 5.3% Current 5% Full Year
5% Normal
15% Full Year
15% Normal
Std Deviation 0.1% 0.1% 50.4% 0.0% 0.0% 0.0% 0.1% 0.3% 0.5% 0.1% 0.1% 0.0% 0.0% Average
40
Option Excess Reserve Capacity Unit 3 FO Status Unit 14 Unit 15 Unit 16 Unit 17 Unit 18 Unit 19 Unit 20 Unit 21 Unit 22 Unit 23 Unit 24 Unit 25 Unit 26 MW 40 320 200 200 100 40 200 100 40 200 100 20 50
Average FO Rate with Unit 3 on 100% FO
4.0% 4.0% 4.0% 4.0% 4.0% 4.0% 4.0% 4.0% 4.0% 4.0% 4.0% 4.0% 4.0%
Average FO Rate with Unit 3 on 10% FO
1.5% 1.5% 1.5% 1.5% 1.5% 1.5% 1.5% 1.5% 1.5% 1.5% 1.5% 1.5% 1.5% FO 1 0% 0 2% 1 0% 0 5% 0 1% 0 1% 0 5% 1 0% 0 2% 3 0% 0 1% 2 0% 0 5% FO 1.0% 0.2% 1.0% 0.5% 0.1% 0.1% 0.5% 1.0% 0.2% 3.0% 0.1% 2.0% 0.5% PO 4.0% 5.0% 50.0% 35.0% 5.0% 10.0% 2.0% 1.0% 5.0% 2.0% 50.0% 20.0% 75.0% IMO DR 5% Full Year 6.0% 7.9% 0.1% 3.5% 8.5% 8.3% 6.9% 6.0% 8.1%
3.8% 1.6%
5% Normal 2.8% 4.2%
1.7% 4.8% 4.8% 3.6% 2.5% 4.7%
2.2%
0.1% 15% Full Year 5.7% 6.8% 0.5% 3.2% 7.7% 7.6% 6.4% 5.6% 7.4%
3.2% 1.8% 0.0% 15% Normal 2.3% 3.4%
1.2% 3.9% 4.0% 2.9% 2.1% 3.7%
1.5% 0.1% 0.1% Std Deviation 1.9% 2.2% 0.4% 1.1% 2.2% 2.1% 2.0% 2.0% 2.1% 1.3% 1.1% 1.1% 0.2% Average 4.2% 5.6% 0.0% 2.4% 6.2% 6.2% 5.0% 4.1% 6.0%
2.7% 0.8% 0.0% IMO DR MIN 1 5% Full Year 6.1% 8.4% 0.5% 3.5% 9.2% 9.2% 7.3% 6.1% 8.8%
3.4% 1.5%
5% Normal 3.0% 5.1%
2.1% 5.8% 5.6% 4.3% 3.0% 5.5%
2.5%
0.0% 15% Full Year 5.9% 7.5% 0.6% 3.5% 8.2% 8.2% 6.8% 5.5% 7.9%
3.4% 1.4%
15% Normal 2.7% 4.1%
1.5% 4.7% 4.6% 3.5% 2.6% 4.6%
2.1%
0.1% Std Deviation 1.8% 2.0% 0.6% 1.0% 2.1% 2.1% 1.8% 1.8% 2.0% 1.5% 0.7% 1.0% 0.1% Average 4.4% 6.2% 0.1% 2.7% 7.0% 6.9% 5.5% 4.3% 6.7%
2.8% 0.6% 0.0% RCP- Linked MIN 1 5% Full Year 7.3% 9.3%
4.0% 10.4% 10.0% 8.1% 6.6% 9.7%
4.7% 0.9%
5% Normal 3.6% 5.7%
2.1% 6.6% 6.5% 5.0% 3.5% 6.2%
3.1%
0.1% 15% Full Year 7.0% 9.0%
4.6% 10.5% 10.4% 8.4% 6.3% 9.8%
4.7% 1.4%
15% Normal 3 9% 5 7% 0 3% 2 3% 6 7% 6 5% 4 9% 3 7% 6 3% 6 3% 3 0% 0 2% 0 1% The Lantau Group 15% Normal 3.9% 5.7%
2.3% 6.7% 6.5% 4.9% 3.7% 6.3%
3.0%
0.1% Std Deviation 2.0% 2.0% 0.1% 1.2% 2.2% 2.1% 1.9% 1.6% 2.0% 0.9% 1.0% 0.9% 0.3% Average 5.5% 7.4%
3.3% 8.6% 8.4% 6.6% 5.0% 8.0%
3.9% 0.4%
Current
5% Full Year ‐1.3% ‐0.2% ‐1.4% ‐0.6% ‐0.1% ‐0.1% ‐0.6% ‐1.4% ‐0.3% ‐4.0% ‐0.2% ‐2.0% ‐0.6%
5% Normal
15% Full Year
15% Normal
Std Deviation 0.1% 0.0% 0.1% 0.1% 0.0% 0.0% 0.0% 0.1% 0.0% 0.1% 0.0% 0.1% 0.1% Average
41
5.0% 10.0% 15.0%
0.0% 5 0% 1 2 3 4 5 6 7 8 9 10 11 12 13 14 15 16 17 18 19 20 21 22 23 24 25 26
The Lantau Group 42
Unit 1 Unit 2 Unit 3 Unit 4 Unit 5 Unit 6 Unit 7 Unit 8 Unit 9 Unit 10 Unit 11 Unit 12 Unit 13 Unit 14 Unit 15 Unit 16 Unit 17 Unit 18 Unit 19 Unit 20 Unit 21 Unit 22 Unit 23 Unit 24 Unit 25 Unit 26 MW 320 200 100 100 100 320 40 20 200 200 20 200 100 40 320 200 200 100 40 200 100 40 200 100 20 50 FO 1.0% 3.0% VARIES 1.0% 0.2% 0.5% 0.5% 6.0% 6.0% 1.0% 1.0% 0.2% 0.5% 1.0% 0.2% 1.0% 0.5% 0.1% 0.1% 0.5% 1.0% 0.2% 3.0% 0.1% 2.0% 0.5% PO 9.0% 12.0% 10.0% 2.0% 5.0% 10.0% 5.0% 20.0% 30.0% 15.0% 5.0% 10.0% 20.0% 4.0% 5.0% 50.0% 35.0% 5.0% 10.0% 2.0% 1.0% 5.0% 2.0% 50.0% 20.0% 75.0%
The Lantau Group 43
Rebate (k$) Proportion
STMRFINT Participant 30 Min Interval Net STEM Refund
716 3.7%
In the capacity year 2010/11: Capacity Resources Market Customers
STEM Refund ILCREF Intermittent Load Capacity Refund Amount
322 1.7%
FRCDRF_FO Facility Reserve Capacity Deficit Refund for Forced Outage
0.0%
FRCDRF_NGC New Generation System Test Refund for 30 Minute Interval
0.0%
FFORFINT Facility Forced Outage Refund for 30 Minute Interval
18153 94.6%
Total
19191 100.0% FFORFINT Refund as Capacity Payment (at MRCP) 2.42% FFORFINT Refund as Capacity Payment (at RCP) 2.91%
Support RECYCLING Performance RCM Outcomes
The Lantau Group
– Adjust RCP through slope and offset parameters to ensure Market Customers are at least as well off
44
8 10 12
Current Mechanism
8 10 12
IMO
Y ≈ 8.23 $/MW Y ≈ 9.15 $/MW
Analysis of Capacity Year 2010/11
2 4 6 1 675 1349 2023 2697 3371 4045 4719 5393 6067 6741 7415 8089 8763 9437 10111 10785 11459 12133 12807 13481 14155 14829 15503 16177 16851 2 4 6 1 675 1349 2023 2697 3371 4045 4719 5393 6067 6741 7415 8089 8763 9437 10111 10785 11459 12133 12807 13481 14155 14829 15503 16177 16851 12
IMO with Floor
12
RCP‐linked
Y ≈ 9.15 $/MW Y ≈ 9.15 $/MW
The Lantau Group
2 4 6 8 10 1 675 1349 2023 2697 3371 4045 4719 5393 6067 6741 7415 8089 8763 9437 10111 10785 11459 12133 12807 13481 14155 14829 15503 16177 16851 2 4 6 8 10 1 675 1349 2023 2697 3371 4045 4719 5393 6067 6741 7415 8089 8763 9437 10111 10785 11459 12133 12807 13481 14155 14829 15503 16177 16851
45
20 lions $
Analysis of Capacity Year 2010/11
5 10 15 Mil Trading Interval over a year Current IMO IMO with Floor RCP‐Linked
The Lantau Group 46
5000
BW2_BLUEWATERS_G1 ( PO = 9.3% ; FO = 2.6% )
5000 5000
ALINTA_WGP_GT ( PO = 1.9% ; FO = 1.4% ) Analysis of Capacity Year 2010/11
‐20000 ‐15000 ‐10000 ‐5000 Trading Interval over a year Current IMO IMO with Floor RCP‐Linked ‐20000 ‐15000 ‐10000 ‐5000 Trading Interval over a year Current IMO IMO with Floor RCP‐Linked 5000
MUJA_G5 ( PO = 18.7% ; FO = 15.8% )
5000
PINJAR_GT11 ( PO = 53.0% ; FO = 0.1% )
The Lantau Group 47
‐20000 ‐15000 ‐10000 ‐5000 Trading Interval over a year Current IMO IMO with Floor RCP‐Linked ‐20000 ‐15000 ‐10000 ‐5000 Trading Interval over a year Current IMO IMO with Floor RCP‐Linked
Note: System average PO and FO rates are 15.4% and 2.0% respectively
The Lantau Group
Cost Efficiency Competition Usage Discrimination
– Minimum refund factor to tie refund exposure to capacity credit value – Maximum refund factor linked to MRCP
Y = promote O = neutral X = conflict
– Rebates of refund revenue based on availability
– Offset RCR using 97 percent factor
The Lantau Group 49
– Slope steepened to -3.75 from -3.25
– Contractual disposition of refunds not affected / rebates can still go to party exposed to refund – Eligibility for rebate corresponds to exposure to refund risk