recognition and management of inflammatory
play

Recognition and Management of Inflammatory Advisor/consultant: - PowerPoint PPT Presentation

12/15/2018 Disclosures Recognition and Management of Inflammatory Advisor/consultant: Galapagos, Janssen, Lilly Back Pain: Essentials for Research grant/support: Amgen, Novartis, Pfizer, UCB Primary Care Providers Lianne S. Gensler,


  1. 12/15/2018 Disclosures Recognition and Management of Inflammatory • Advisor/consultant: Galapagos, Janssen, Lilly Back Pain: Essentials for • Research grant/support: Amgen, Novartis, Pfizer, UCB Primary Care Providers Lianne S. Gensler, MD University of California, San Francisco Case 
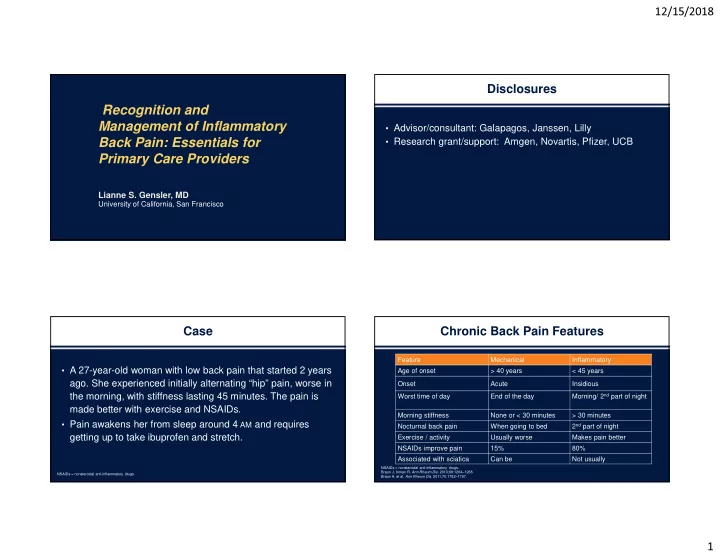
Chronic Back Pain Features Feature Mechanical Inflammatory • A 27-year-old woman with low back pain that started 2 years Age of onset > 40 years < 45 years ago. She experienced initially alternating “hip” pain, worse in Onset Acute Insidious Morning/ 2 nd part of night the morning, with stiffness lasting 45 minutes. The pain is Worst time of day End of the day made better with exercise and NSAIDs. Morning stiffness None or < 30 minutes > 30 minutes • Pain awakens her from sleep around 4 AM and requires 2 nd part of night Nocturnal back pain When going to bed getting up to take ibuprofen and stretch. Exercise / activity Usually worse Makes pain better NSAIDs improve pain 15% 80% Associated with sciatica Can be Not usually NSAIDs = nonsteroidal anti-inflammatory drugs. Braun J, Inman R. Ann Rheum Dis . 2010;69:1264–1268. NSAIDs = nonsteroidal anti-inflammatory drugs. Braun A, et al. Ann Rheum Dis . 2011;70:1782–1787. 1

  2. 12/15/2018 Inflammatory Back Pain: ? Question Hallmark Feature In the National Health and Nutrition Examination Survey Feature Odds Ratio (NHANES), chronic axial pain was found in ~20% of the population. Insidious onset 12.7 Of these people, what percent had inflammatory back pain? Pain at night (with improvement upon awakening) 20.4 46% Age at onset <40 years 9.9 A. 1% of the chronic back pain population Improvement with exercise 23.1 B. 5% of the chronic back pain population 20% 20% No improvement with rest 7.7 14% C. 15% of the chronic back pain population Sensitivity 79.6%; Specificity 72.4% D. >25% of the chronic back pain population Positive LR = 79.6/(100-72.4) = 2.9 ~Probability = 14% LR = likelihood ratio. Sieper J, et al. Ann Rheum Dis . 2009;68(6)784-788; Rudwaleit M, et al. Ann Rheum Dis. 2009;68(6):777-783; Ozgocmen S, et al. J Rheumatol . 2010;37(9):1978. Rheumatoid Arthritis versus NHANES 2009 to 2010 Spondyloarthritis • 19.2% chronic axial pain 1.6 1.4 • In patients with chronic axial pain, 28% to 35.5% had inflammatory 1.4 back pain (IBP) 1.2 • US prevalence of IBP: 5% to 6% 1 0.8 Prevalence of SpA in US adults 20 – 69 years of age: the NHANES 2009–2010* % 0.6 0.52- 0.55 Total population Number of SpA cases 0.6 Case type Prevalence, % SE 95% CI sampled 0.4 ESSG SpA Rheumatoid Ankylosing 5,103 70 1.4 0.2 1.0–1.9 Spondyloarthritis 0.2 (Overall † ) Arthritis** Spondylitis (Axial)* 0 • Self-reported prevalence of ankylosing spondylitis = 0.55 Prevalence *SpA = spondylarthritis; NHANES = National Health and Nutrition Examination Survey; CI = confidence interval; ESSG = European Spondylarthropathy Study Group. † Estimates were age adjusted to the midpoint of the current population survey estimate * In US adults aged 20 to 69 years in the NHANES 2009-2010. Reveille JD, et al. Arthritis Care Res (Hoboken) . 2012;64(6):905-910. ** Helmick CG, et al. Arthritis Rheum . 2008;58(1):15-25. for the 2010 US civilian population. For race/ethnicity, only data for the major US Weisman MH, et al . Ann Rheum Dis. 2013;72(3):369-373. Reveille JD, et al. Arthritis Care Res (Hoboken) . 2012;64(6)905-910. subgroups are shown. 2

  3. 12/15/2018 ? Your Next Step Is To… Case 2: Your Next Step Is To… 27-year-old woman with low back pain that started 4 months ago. Initially • Evaluate for other symptoms: alternating “hip” pain, worse in the AM w/ stiffness lasting 45 mins. The – Peripheral joint pain, heel pain, chest wall pain, bloody stools/ pain is made better with exercise and NSAIDs. Pain awakens him from sleep around 4 AM and requires him to get up, take ibuprofen, and stretch. diarrhea, rashes 42% • Evaluate for other diagnoses: A. Check HLA B27 – Acute anterior uveitis, Crohn’s disease, ulcerative colitis, psoriasis 26% 23% • Assess family history: B. Check ESR / CRP 9% – ~20% AS patients have a first-degree relative with AS C. Order imaging study – Cross relative risk in AS and IBD = 3.0 D. Obtain additional history AS = ankylosing spondylitis. Thjodleifsson B, et al. Arthritis Rheum . 2007;56(8):2633-2639. BB8 Probability of Spondyloarthritis Using Multiple Clinical and Lab Features Case (continued) AS in Chronic Low Back Pain Population 5% Inflammatory back pain LR 3.1 Heel pain (enthesitis) LR 3.4 Pr = • A 27-year-old woman with IBP: 98% Peripheral arthritis LR 4.0 – The patient tells you that her father has psoriatic arthritis Dactylitis LR 4.5 Acute anterior uveitis LR 7.3 LR 101 � Positive family history LR 6.4 Probability = • How does this additional data change your assessment? 84% Good response to NSAIDs LR 5.1 Elevated acute phase reactants LR 2.5 HLA-B27 LR 9.0 LR 15.81 � MRI LR 9.0 Probability = 45% 3.1 multiplied by 5.1 gives a likelihood product of 15.81. Family history � LR 15.81 x 6.4 = 101. HLA-B27 = human leucocyte antigen-B27; LR = likelihood ratios; Pr = Probability. Rudwaleit M, et al. Arthritis Rheum . 2005;52(4):1000-1008. 3

  4. Slide 12 BB8 The figure has elements from Fig 3 in the referenced article, but is not the same. No permission needed. Betti Bandura, 5/17/2017

  5. 12/15/2018 Axial Spondyloarthritis Spondyloarthritis: Family of Diseases 25% to 40% Acute Anterior Acute Anterior DIAGNOSIS Uveitis Uveitis Non-radiographic stage Radiographic stage Axial Spondyloarthritis: Back pain sacroiliitis and Back pain Back pain spondylitis Radiographic Sacroiliitis on MRI Syndesmophytes sacroiliitis Inflammatory Inflammatory Psoriasis Psoriasis 10% 5% to 10% Bowel Disease Bowel Disease Time (years) Subclinical Colitis 25% to 60% Extra-articular manifestations & comorbidities Rudwaliet M, et al. Arthritis Rheum . 2005;52(4):1000-1008. Hochberg M, et al. In: Rheumatology . 6th ed. St. Louis, MO: Mosby; 2014:Sec 9; Ch 114, 946-950. Age at First Symptoms and at First Diagnosis in The Axial SpA Spectrum Ankylosing Spondylitis Patients 100 ASAS Axial SpA Criteria Ankylosing Spondylitis Cumulated percentage of Non-radiographic Axial Age at first symptoms Modified NY Criteria 80 Spondyloarthritis Age at first diagnosis 60 patients Radiographic (Milder disease sacroiliitis 40 Or Early disease) Bamboo 20 spine 920 males 476 females 0 0 10 20 30 40 50 60 70 Age in years Average delay in diagnosis: 9 years ASAS = Assessment of SpondyloArthritis International Society; SpA = spondyloarthritis. DAMAGE Helmick CG, et al. Arthritis Rheum . 2008;58(1):15-25. Feldtkeller E, et al. Curr Opin Rheumatol . 2000;12(4):239-247. Reveille JD, et al. Arthritis Rheum . 2012;64(5):1407-1411. Reveille JD, et al. Arthritis Care Res (Hoboken). 2012;64(6)905-910. 4

  6. 12/15/2018 The Axial SpA Spectrum Axial Spondyloarthritis Epidemiology • Age of Onset: ~24 years (up to 45 years old) Features Axial Ankylosing Non-radiographic Axial Spondyloarthritis Spondylitis Spondyloarthritis • Prevalence: Follows prevalence of HLA-B27 Gender (M:F) 1:1 2-3:1 1: 1-2 HLA-B27 -- 85% 60% • HLA-B27 1.4% .55% -- Prevalence Damage on Mild possible but not – Ethnicity Variable Always x-ray required � High: Inuit and Scandinavians Inflammation Possible but not Variable Always for classification on MRI necessary � Low: Sub-Saharan Africans, Australian Aboriginals, Japanese axSpA = axial spondyloarthritis. Lee W, et al. Ann Rheum Dis . 2007;66(5):633-638. Boyer GS, et al. J Rheumatol . 1994;21(12):2292-2297; Feldtkeller E, et al. Curr Opin Rheumatol . 2000;12(4):239-247; Reveille JD, et al. Arthritis Care Res (Hoboken) . 2012;64(6):905-910. Lee W, et al. Ann Rheum Dis . 2007;66(5):633-638; Tikly M, et al. Curr Rheumatol Rep . 2014;16(6):421. BB18 HLA-B27 in the US Population Referral Strategy Prevalence of HLA-B27 in US Adults Aged 20-69 Years, by Selected Characteristics. 2009 Data. Sample Prevalence No. Positive for Total Selected characteristics HLA-B27 Population % (95% CI) Overall US prevalence 124 2,320 6.1 (4.6, 8.2) Sex Male 53 1,123 5.8 (3.9, 8.4) Female 71 1,197 6.5 (4.7, 8.9) Race/ethnic group Non-Hispanic white 79 1,021 7.5 (5.3, 10.4)± Mexican American 27 622 4.6 (3.4, 6.1)§ Non-Hispanic black 4 345 1.1 (0.4, 3.1)¶ Pooled dataset sensitivity and specificity of referral rule 75% and 58% *For race/ethnicity, only data for the major subgroups in the US are shown, which therefore do not sum to the overall sample size. All race/ethnicities are included in the overall prevalence estimates and in the prevalence estimates by sex and age. ‡ P <.01 versus all other race/ethnic groups combined. § P <.05 versus non-Hispanic white persons. ¶Estimates do not meet criteria for statistical stability. van Hoeven L, et al. PloS One . 2015;10(7):e0131963. Reveille JD, et al. Arthritis Rheum . 2012;64(5):1407-1411. 5

  7. Slide 20 BB18 Published (Figure 2). No permission necessary under the Creative Commons License CC BY 4.0. Betti Bandura, 5/17/2017

Download Presentation
Download Policy: The content available on the website is offered to you 'AS IS' for your personal information and use only. It cannot be commercialized, licensed, or distributed on other websites without prior consent from the author. To download a presentation, simply click this link. If you encounter any difficulties during the download process, it's possible that the publisher has removed the file from their server.

Recommend


More recommend